Monday, 27 January 2014

Winter hydrograph pattern


The above hydrograph shows the usual winter pattern when autumn rains decrease through the end of the year as temperatures drop and precipitation decreases or changes to snow. We can see that after January 8th, the streamflow levels are mostly decreasing until the moderately-sized peak on the 26th. The long period of decreasing flows in January indicates that temperatures have been cold with little or no rainfall until the 26th. However, it has mostly been dry and cold without snow in the Niigata region, and snowpack levels remain extremely low. The rain-on-snow peak flow on the 26th was caused by daily rainfall of 26.5mm (maximum intensities of 4.5mm/h), and temperatures reaching 8-9 degrees C leading to some snowmelt.

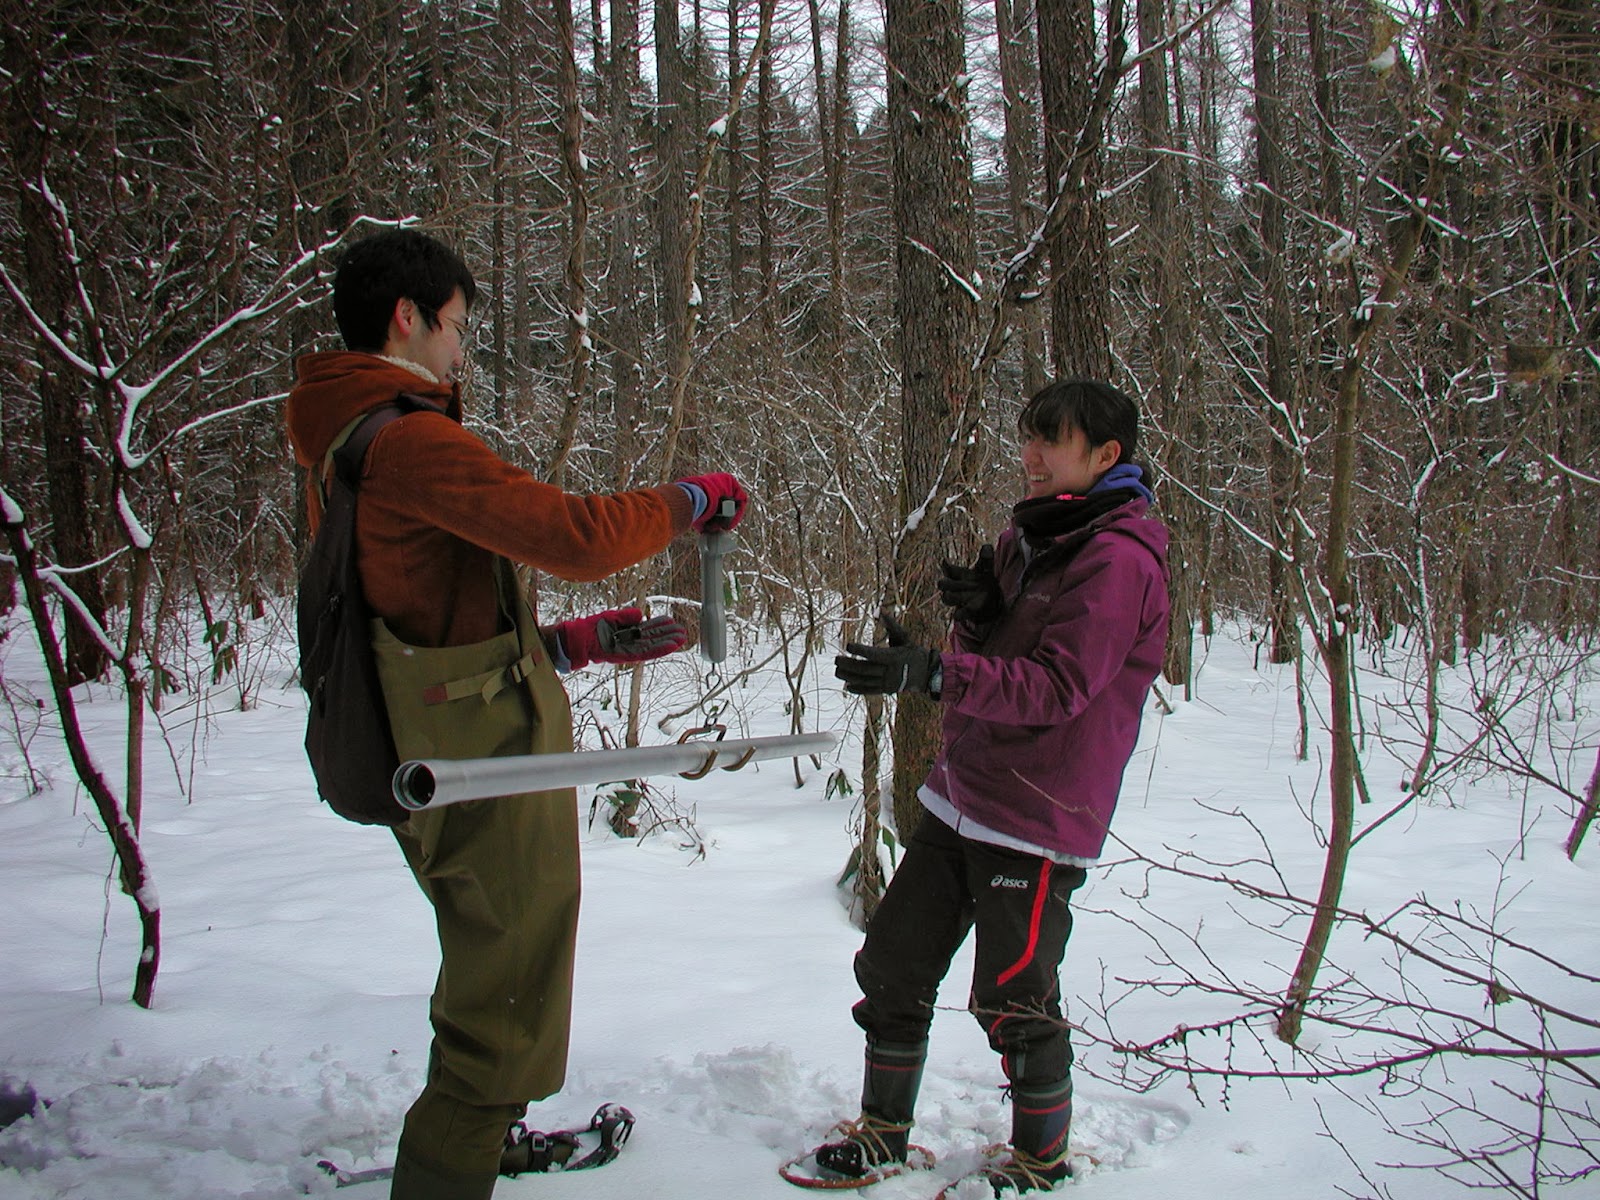
In the photos below we are doing snow survey to measure the snow depth and snow water equivalent in locations where we have also installed snow lysimeters. Snow depths are very low this year, with only about 55cm at the larch site, 35cm at the mature cedar site, and anywhere between 30 and 82cm at the young cedar site which has very uneven snow depths due to the canopy interception processes.

Snow survey at the larch site (depth = 55cm)

Snow survey at the young cedar site (depth = 30-82cm)

Larch site lysimeter, with relatively uniform snow depth

Mature cedar site lysimeter, with outline of lysimeter trays visible

Young cedar site lysimeter showing the mounding of the snow between the trees, with very shallow depths close to the tree trunks

Thursday, 9 January 2014

Where is the snow this year?


Very little snow so far this winter season. We could be heading for the least snowpack in over 10 years! Conditions were mild and relatively dry during end of December to early January when we usually expect the first heavy snows of winter.

Today we did snow survey at the three snow lysimeter locations. The mature cedar location (shown above) had a snow depth of only about 10 cm, while the neighbouring larch stand had a depth of about 30 cm, showing the influence of the snow interception processes such as canopy melt-drip in the cedar forest stand. During mild conditions, the intercepted snow in the cedar stand is soon melted, while the snow tends to accumulate in the larch stand where there is very little snow interception.

Monday, 16 December 2013

Soil temperature patterns


Today we had two main jobs: (1) cleaning and setting up the snow lysimeters for the coming winter season, and (2) visiting the zero-order basin to download the soil temperature data.

Above you can see the data for soil and spring water temperature for a period of three years obtained about 10 years ago. The seasonal pattern is clear, with stronger fluctuations in soil temperatures nearer the surface, and we can also see the impact of the seasonal snow cover very clearly during December to April. The sudden rise in soil temperatures in spring can only occur after the snow cover has melted off.

Also plotted in the figure above is the spring water temperature, which has a smaller range of variation compared to the soil temperatures, ranging only between about 9.5 and 13 degrees Celsius. This is because the spring water is flowing out from much greater depths where ground temperatures are almost constant year-round at approximately the mean annual air temperature.

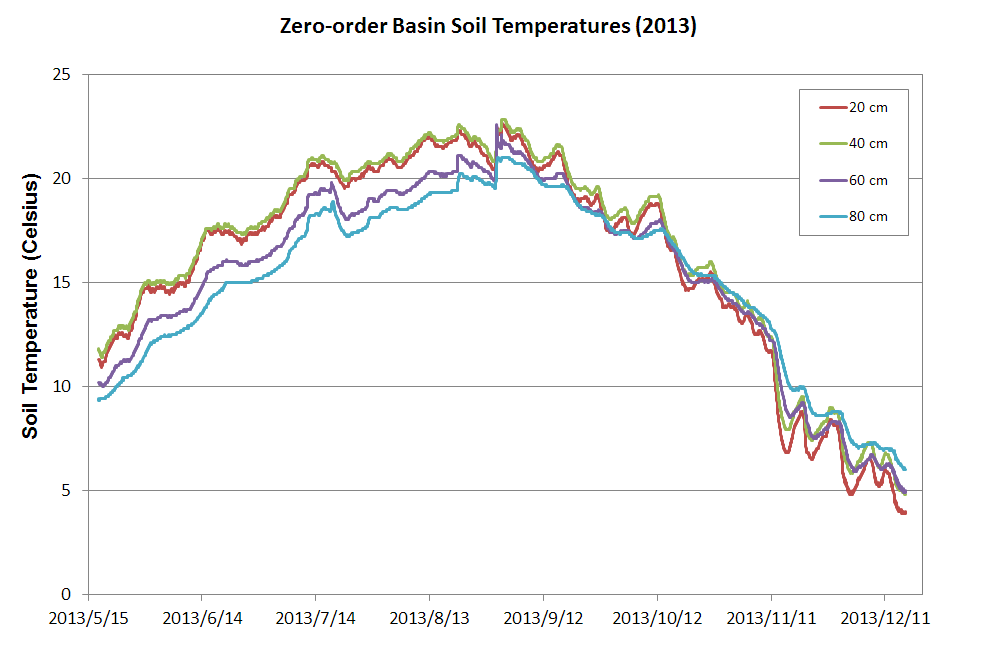
Below you can see the data downloaded for May to December 2013. During the summer season the temperatures nearer the surface are normally warmer due to the influx of energy with warmer air temperatures. However, the chart here shows the 20 cm and 40 cm depths to have almost the same temperatures, with the 40 cm depth even a little warmer. As the monitoring has been ongoing for over 10 years now, I suspect that the sensor wires have been subjected to stresses and movement within the soil column, causing problems with data reliability. The 100 cm depth data was suspect and removed from the chart. It is time to renew and re-install the monitoring equipment.

Monday, 25 November 2013

Autumn rains gather pace


The autumn rainy season has got into full swing over the past month as you can see in the hydrograph above. November 20th shows a peak stage of around 90 cm after about 120 mm of rain fell over 2 days with intensities up to 11 mm/h. Stage is likely to remain at around 60 cm or higher until the winter snows arrive next month.

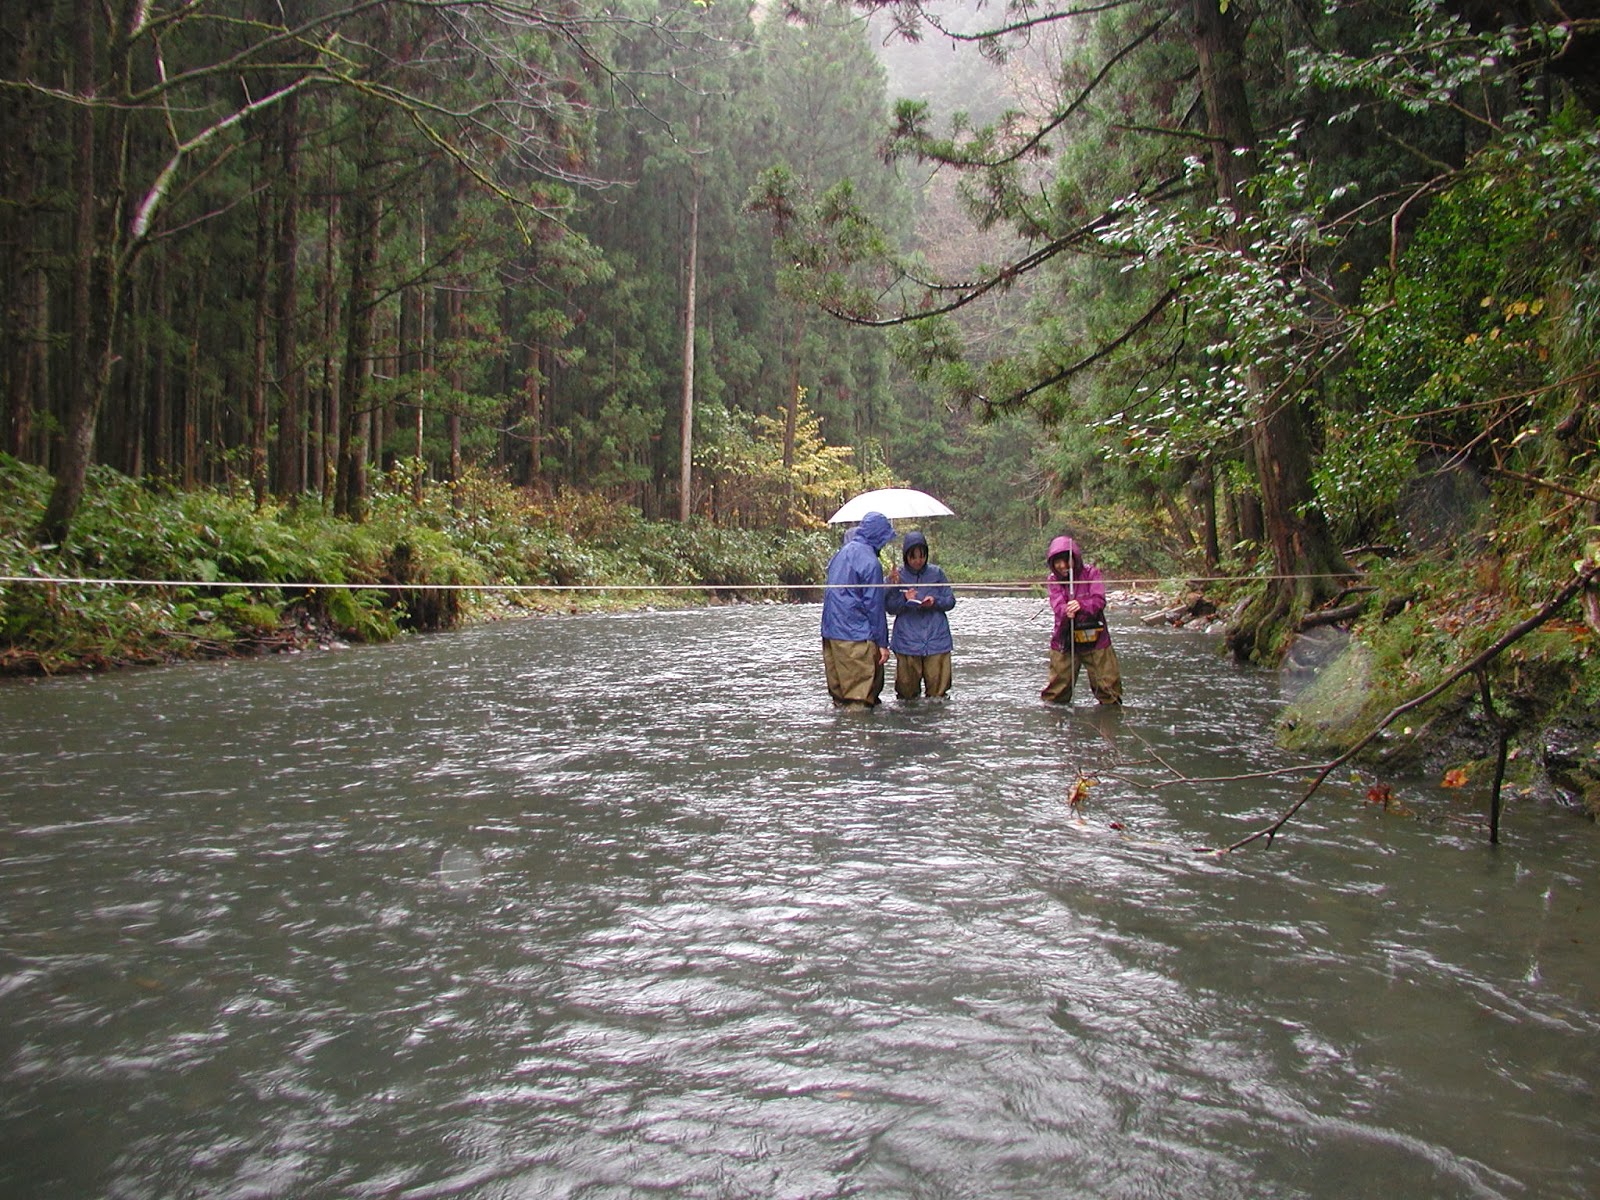
Weather conditions during today's survey were cloudy and relatively warm at 14 degrees C in the afternoon. After measuring the river discharge, we prepared for the winter season by cleaning the snow lysimeters and charging the winter precipitation gauges with antifreeze.

Stage = 62.5 cm, Ta = 9.9 C, Tw = 10.3 C

Monday, 11 November 2013

First blast of winter

Stage = 59cm, Ta = 5C, Tw = 10C

December-like conditions today as heavy rain and sleet sweep in with strong winds. The air temperature in Murakami on the coast is just 3 degrees C, so the mountains will have been getting their first big accumulation of snow. Air temperatures were around 5 degrees at the gauging point, and with water temperatures around 10 degrees it made for very cold conditions to take a discharge measurement.

Tuesday, 22 October 2013

New Water Year


The new water year starts on October 1st. Generally soil water and ground water levels are low at the end of the summer season, and it is convenient to start the new water year when storage in the basin is low and similar from year to year. During October the autumn rains arrive, and as temperatures drop, the levels of ET decrease and streamflow levels rise. Look at the hydrograph above and see how the low flows between the rainy peaks are increasing through October.

Taking a discharge measurement in light rain

Landslip zone upstream from the gauging point which supplies fine sediment

Friday, 4 October 2013

Fine autumn weather


The past two weeks have been almost continuous sunshine, with very little precipitation. You can see from the hydrograph above that discharge has been steadily decreasing, although 18mm of rain fell on the 3rd October giving a small blip. Flows now are close to the yearly minimum flows. But the autumn rains are on the way soon, and as the temperatures cool then evapotranspiration decreases. This leads to more water in the river as runoff as we go through autumn.

Stage = 36cm, Ta = 15.6C, Tw = 14.5C