Tuesday 14 November 2017

Autumn rains bring higher baseflows


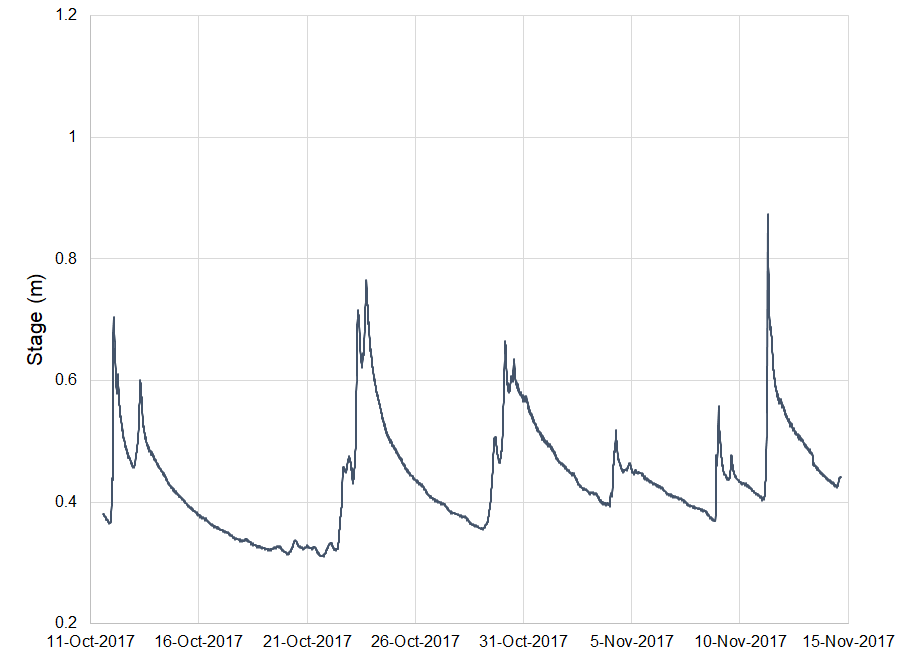
The hydrograph above shows the typical situation in autumn season when more frequent rainfalls and decreasing evapotranspiration leads to rising levels of baseflow. The interval between the rainfall events is becoming shorter, and note how the baseflow in between events is steadily rising. The baseflow level will remain high into December, only decreasing once the temperatures drop sufficiently for precipitation to change from rainfall to snowfall.


Wednesday 11 October 2017

Stage recorder battery change


Early autumn is a good season for the annual change of the batteries in the Kadec stage recorders (main river and tributary sites). Cold winter temperatures are hard on batteries, but this way we enter the winter season with fresh batteries. I also did the bi-monthly download of the Hobo stage recorder, which acts as a back-up stage recorder on the main river. Again, very close agreement between the two stage recording systems which is always very reassuring (upper hydrograph). The lower recent hydrograph data shows mainly low flow conditions from late September into October.


Friday 22 September 2017

First discharge measurement


Today I am joined by some new faces in the field - for three of our members it is the first time to make a discharge measurement. Our measurement is very important in establishing the new stage-rating curve after the channel degradation during summer floods. As shown in the stage hydrograph below, the recent 11 days have been mostly low flows with minor rainfall events.


Monday 11 September 2017

Late summer low flows


A series of storm events during late August led to multiple peaks in the stage hydrograph shown below, the highest peak reaching almost 1.4 metres. September is normally a season of late summer low flows when the annual minimum daily flows are often recorded. Aggradation and accumulation of sediment in the gauging reach occurred in early summer floods, but these recent floods have led to net removal of sediment and deepening of the channel in the gauging reach. Changes in the stage-rating curve need to be closely monitored to maintain accuracy in discharge estimation.


Thursday 10 August 2017

Change in stage-rating curve?


The 587 mm of rainfall for July was the second highest monthly precipitation since records began in 1981. The highest recorded was 639 mm for July 2013. Although the maximum flood stage and peak discharge was not particularly high last month (1.26 m, 30 m3/s at 11:30 on 24 July), the hydrograph shows multiple peaks around 1.0-1.2 m stage.

Comparing the measured discharge with the estimated discharge from the stage-rating curve, we find a discrepancy of about 25%. The discharge is 25% higher than we expect from using the current stage-rating curve, indicating degradation of the channel during the floods of 24 July. The removal of the sediment deposited from the tributary channel earlier in July is also evidence of likely channel degradation. Further discharge measurements are needed in the near future to confirm this change in the stage-rating curve.

Young hydrologist - first discharge measurement (Grade 4)


Friday 21 July 2017

587 mm of rainfall in July


This July has had more than twice the usual rainfall, with 587 mm at the Miomote Amedas Station compared to an average of 263 mm (1981-2010). Maximum daily precipitation was 119 mm on July 24, and maximum hourly precipitation was 48 mm on July 18th. While the above hydrograph only shows data until July 21, it shows that the rainfall did not produce any particularly large floods. Instead there were multiple floods and peaks with a moderate stage of 0.8 m to 1.1 m.


The above two photographs show the water to be running very clear. However, the intense and localized storm of July 18 (max. 48 mm/h) seems to have been centered in the tributary basin which joins the main stem of Takiya River by the bridge abutment shown in the photographs below. There is a large accumulation of bedload sediment at the confluence below the bridge as the main stem did not appear to have the flow required to transport the sediment downstream.


Wednesday 28 June 2017

Waiting for the rainy season

Stage = 31.3cm, Discharge = 0.38m3/s
No significant rainfall has occurred since the rainy season was officially declared, and discharge levels are close to annual minimum values. Early June saw a moderate rainfall event over 2-3 June with 56mm of precipitation. Visiting the upper part of the neighbouring Miomote River basin we could see that the high peaks (>1500m elevation) still had some snow cover. However, lack of rainy season precipitation could lead to low flow conditions in the coming weeks.


Asahi Mountains from near Okumiomote Dam

Monday 29 May 2017

End of snowmelt season


The hydrograph above shows the recession of snowmelt runoff during the second half of May. The diurnal melt pattern has mostly gone by 24 May, and the subsequent peaks are due to rainfall (51mm rainfall over 26-27 May at Miomote Amedas station). A discharge measurement confirmed no change in the stage-rating curve, which has remained stable for nearly three years now.

Stage = 0.45m, Discharge = 1.18m3/s, Specific discharge = 0.0607 m3/s/km2

Monday 22 May 2017

JICA field training


JICA (Japan International Cooperation Agency) participants on the course "Irrigation and Drainage Technology Based on Integrated Water Management" joined me at Takiya River for basic hydrological field survey. We measured discharge in three teams using different equipment and compared the results. Sampling of the channel bed materials using the Wolman Pebble Count was also undertaken. Participants came from various countries in Africa and Asia (Cambodia, Malawi, Mozambique, Myanmar, Philippines, Rwanda, South Sudan, Tanzania and Uganda) to study for six months in Japan.


Arakawa from Maruyama Bridge (Sekikawa Village)

Wednesday 10 May 2017

Snowmelt season


Today I was joined by participants from my graduate class in Snow Hydrology. We observed the snowmelt runoff condition, and measured the discharge, confirming no changes have occurred in the stage-rating curve.

Above you can see the typical snowmelt runoff pattern in the stage hydrograph. The larger peaks above 0.8m are all connected to rainfall events, while the regular sine-wave fluctuations are due to fine weather snowmelt (e.g. early May). These fluctuations are closely related to the energy balance of the snowpack and the diurnal change in air temperature.

Monday 3 April 2017

High winter runoff

Takiya River stage during winter 2016-2017 (good agreement between the two logger-sensor systems)

The hydrograph above shows the period from late November to early April, and from this we can see that winter runoff was relatively high due to mild temperatures and a greater proportion of precipitation falling as rain as opposed to snow. This is what we expect in a warmer climate.

There is only a relatively short cold snowy period with decreasing stage from 10-29 January. There are multiple peaks from late November to early January as precipitation was mainly rain, and the period late January to February shows five peaks which are all connected to rainfall events. Snow survey shown in the figure below shows that seasonal snowpack did not accumulate at the basin mouth until 10 January, about 2-3 weeks later than average. Peak accumulations measured on 20 February were also well below average.


Today in very cold but dry conditions we measured the river discharge to check the stage-rating curve. For a stage of 49cm the discharge was 1.66m3/s, or about 6% above the stage-rating curve estimate. The depth and cross-section data showed that the greater than average winter flows may have caused some scour (deepening) of the streambed.


Photos: T. Kobayashi

Thursday 23 March 2017

Young hydrologists


Now into the melt season, today I introduced a young hydrologist to the joys of snow survey. You need to have strong arms to hold up and weigh the snow sample, and stamina to deal with the cold conditions, but today we could enjoy fairly mild spring temperatures. Nearly 50cm snow depth (19cm SWE) remained at the larch site.

Snow survey result
Depth:    larch 48cm / cedar 33cm
Density: larch 0.39 / cedar 0.33
SWE:     larch 18.5 / cedar 10.5
(SWE = snow water equivalent)


Monday 20 February 2017

Rainy snow survey


Snow survey in the cold rain is one of the hardest conditions in which to do fieldwork. Today Mr. Kobayashi and I sampled two locations close to the river at elevations of about 50m above sea-level. As expected and as always, the larch site had a significantly greater snowpack than the cedar site due to much less snow interception in the canopy.

Snow survey result
Depth:    larch 70cm / cedar 50cm
Density: larch 0.37 / cedar 0.31
SWE:     larch 25.9cm / cedar 15.7cm

Depth and density were higher at the larch site, giving a snow water equivalent (SWE) of about 26cm compared to only 16cm at the cedar site. These values are well below average for late February, reflecting the late start to the snowpack accumulation, which began around 11 January.


Photos: T. Kobayashi

Wednesday 11 January 2017

No snowpack yet


About one month earlier Mr. Kobayashi and I had set up and cleaned the snow lysimeters. However, even by mid-January only trace snowpack had accumulated at the lower elevations of the Takiya River basin. In close to 20 years of field work at this site, this is the least snowpack ever recorded for mid-January. Precipitation levels have been normal to high, but it has fallen almost entirely as rainfall rather than snowfall due to warmer than average temperatures. We had to repeat our work of cleaning the lysimeter drains as snowfall just began to accumulate on the ground that morning. Photos by Mr. Kobayashi.