Friday 2 September 2022

Largest flood on record occurs August 3rd 2022


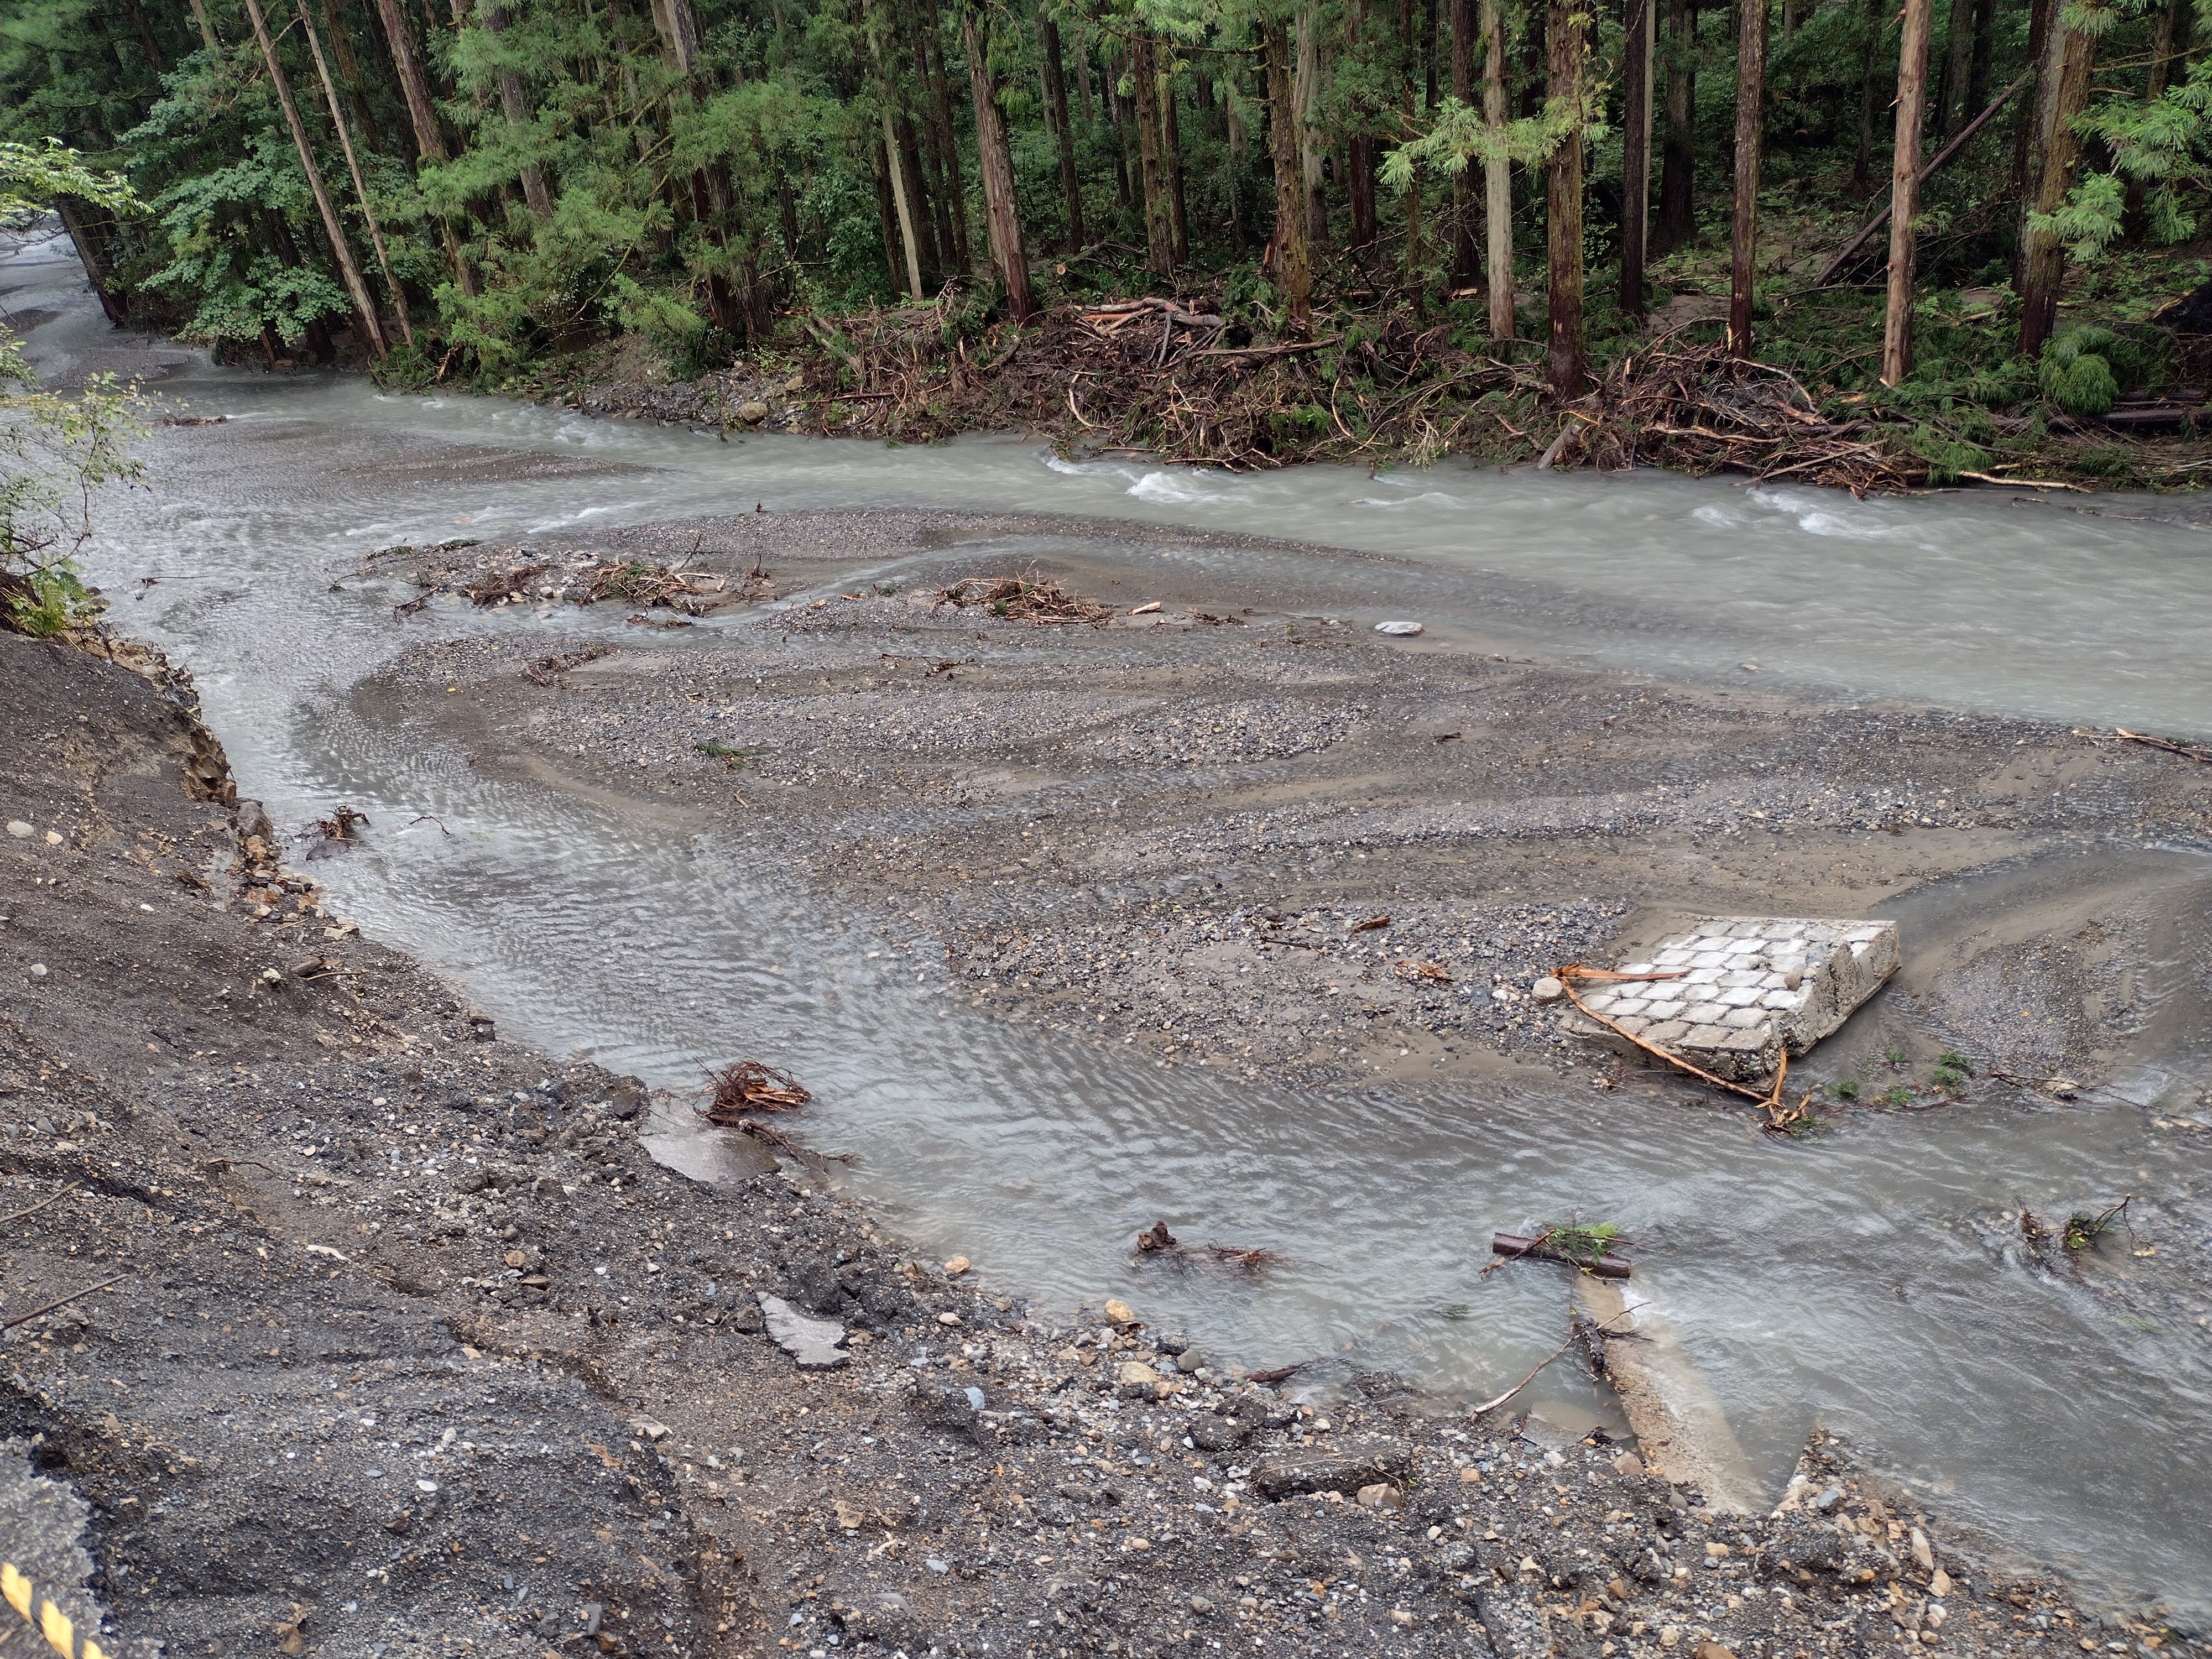
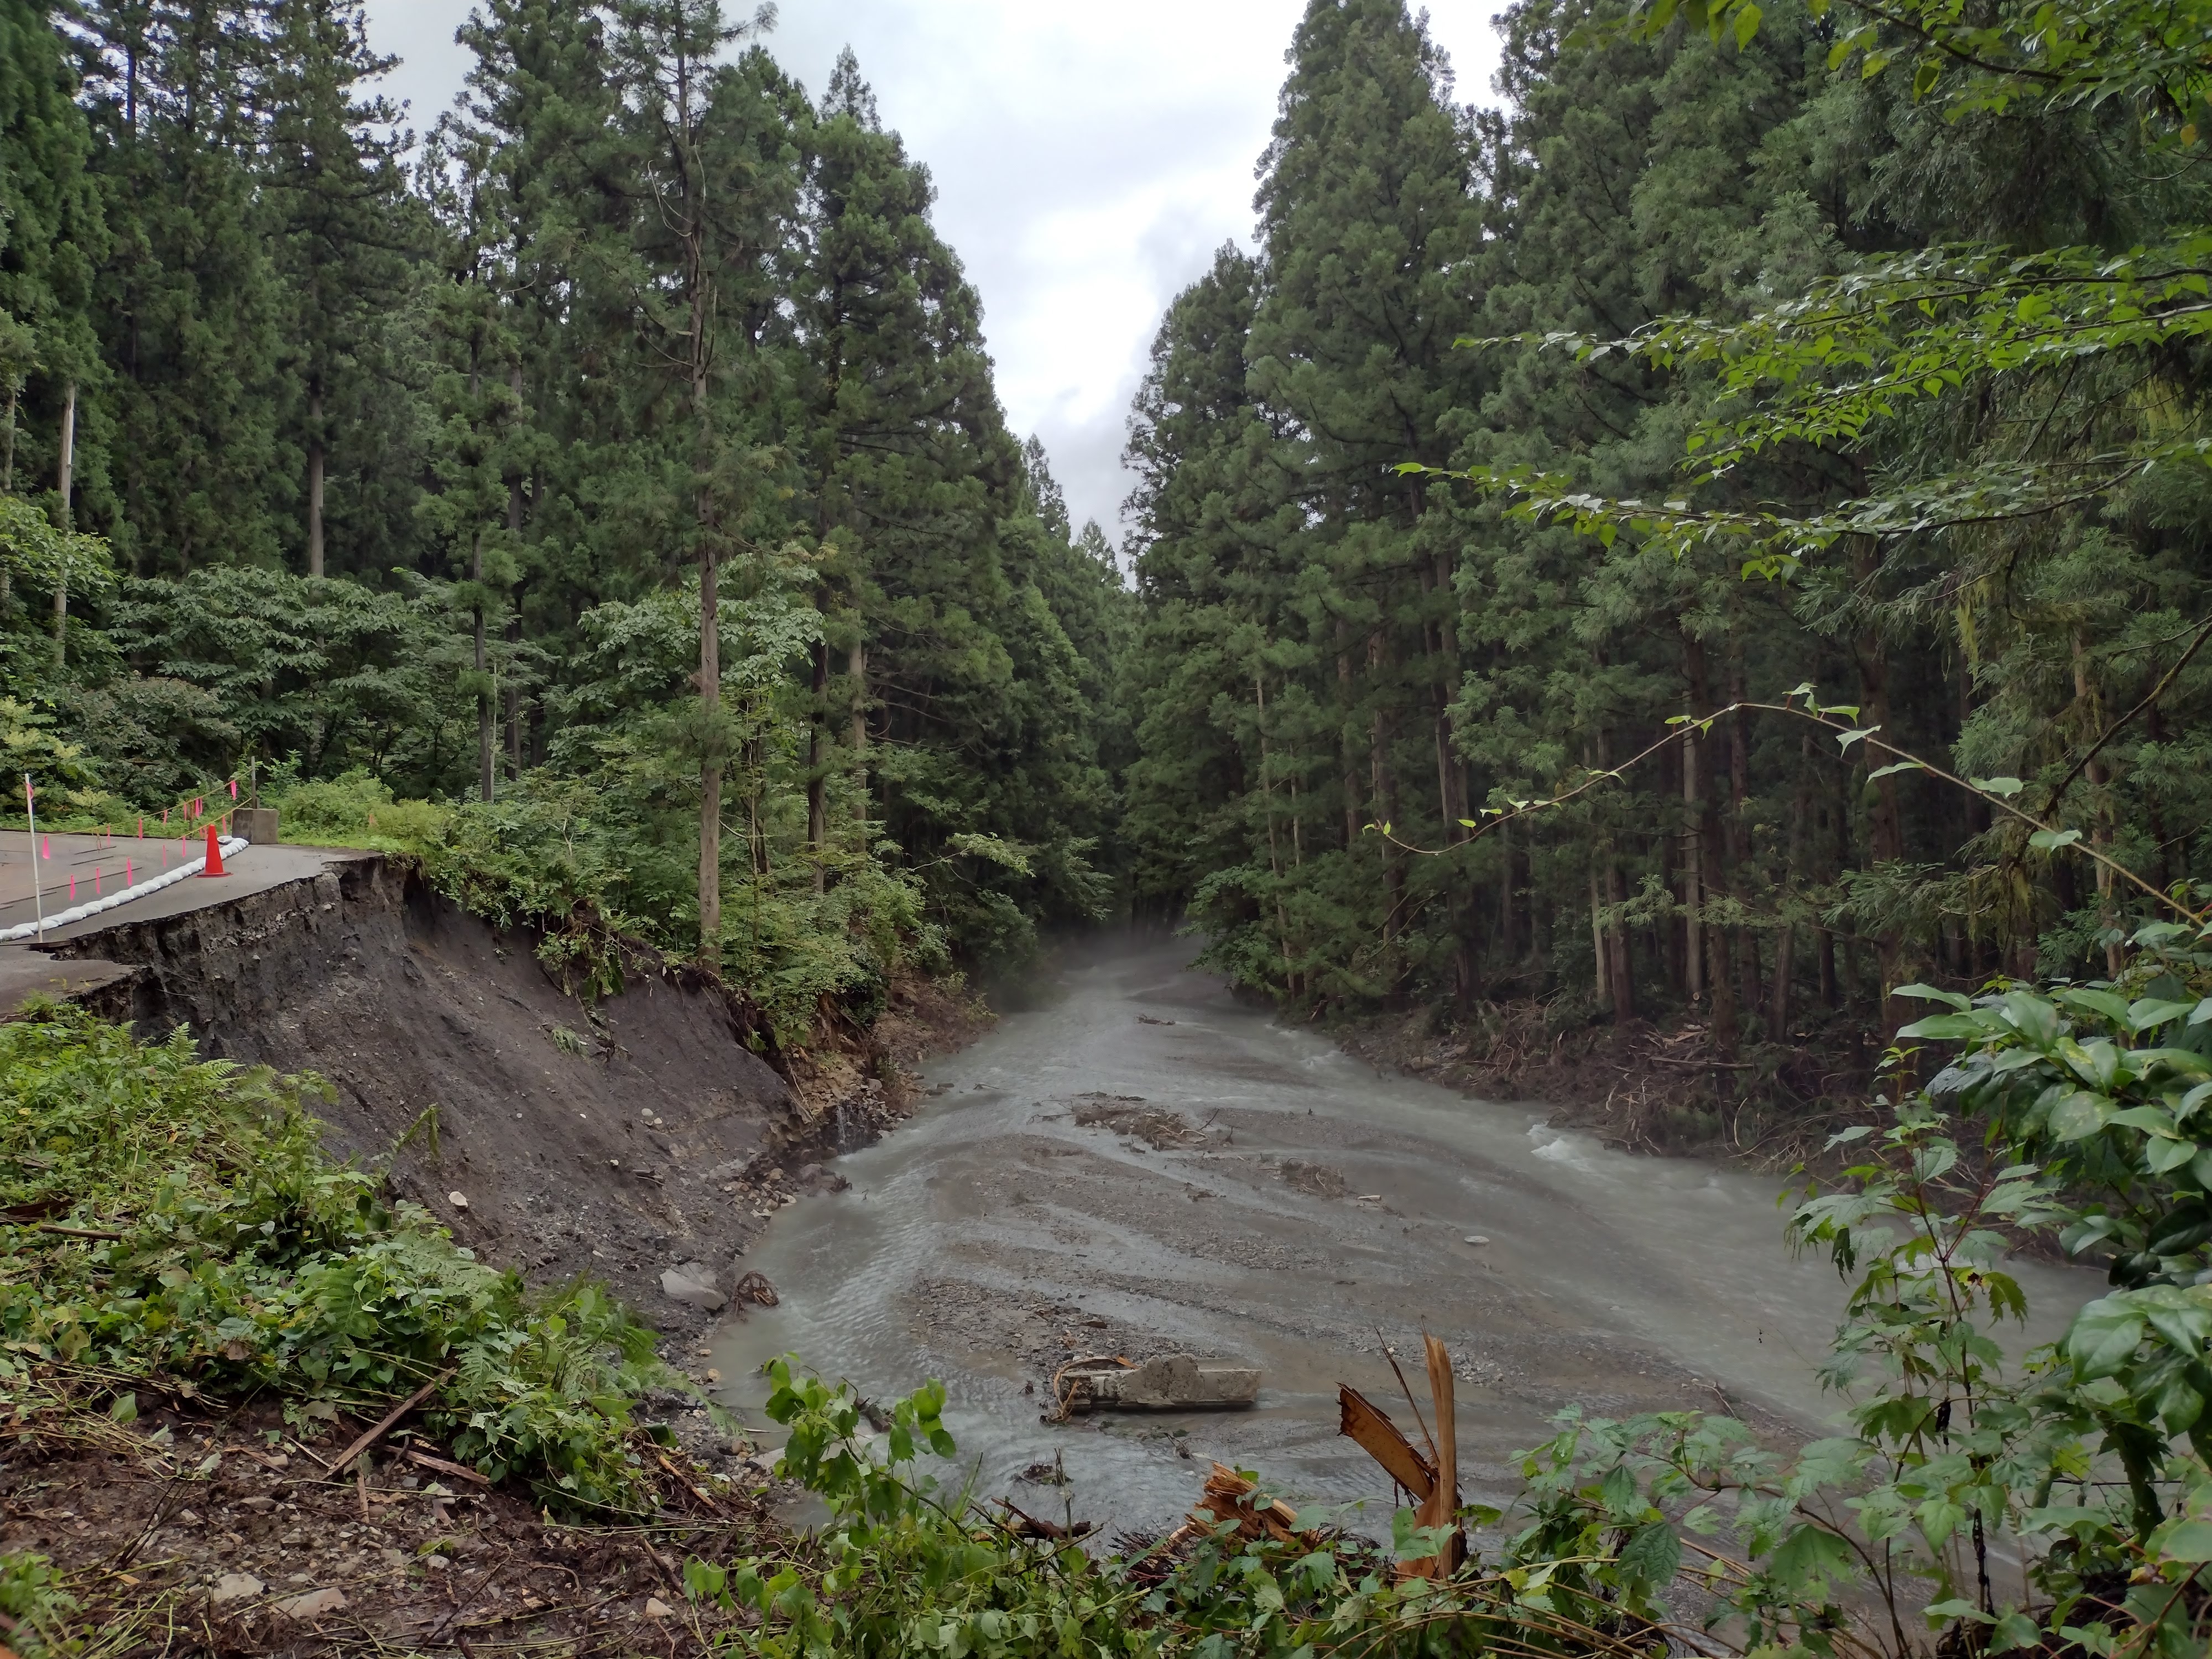
The largest flood on record (since 2000) occurred at Takiya River on August 3rd during record-setting rainfall in the region of Murakami City over August 3rd and 4th. Unfortunately there was much flood damage within Murakami City as several rivers burst their banks, and at Takiya River catastrophic bank erosion and channel aggradation took place. Damage occurred to the staff gauge and at least one of the sensors recording river stage. A second stage sensor is assumed to be buried under about 50-60 cm of fresh sediment accumulation. The whole channel reach shows a similar level of sediment accumulation (channel aggradation). The excess of sediment in the channel has led to braided channel features where multiple channels are flowing around islands of sediment accumulation.


New daily precipitation records were set at several gauges, with maximums of 397 mm/d and 396 mm/day for Ishiguro Mountain and Takane gauges respectively on August 3rd. New hourly precipitation records were also recorded, with a maximum of 149 mm/hour for Shimoseki gauge on August 4th (almost a record for the whole of Japan's Amedas database). New 10-minute precipitation records were set for two gauges, with a maximum of 30 mm/10 minute for Shimoseki gauge. The total 2-day precipitation recorded at Shimoseki was 569 mm! The data in the table below shows that the intense precipitation was extremely localized, especially on August 4th.


Daily and maximum hourly and 10-minute precipitation (mm) recorded by Japan Meteorological Agency and Miomote Dam during August 3-4, 2022

Date         Gauge         Daily  Hourly  10-min.

August 3  Takane              396     70          20
                 Ishiguro Mt      397     57
                 Miomote Dam  260    81
                 Miomote           232    95          27
                 Shimoseki        189     52          13
                 Nakajo             134     37          13

August 4  Takane              18        10          6.5
                 Ishiguro Mt      52        14
                 Miomote Dam  36        15
                 Miomote          40        12          6
                 Shimoseki        380      149        30
                 Nakajo             158       92         23.5


The first hydrograph below shows the river stage during August 3rd to 4th, although correct recording of stage is lost when the stage is rapidly rising towards 3 metres. The sensor cable was snagged by debris and the sensor forcibly pulled out from the sensor housing in the river. We can see there were three large peaks above 2 metres up to this point. Previously, the maximum stage recorded was 2.59 metres on August 11th 2005. The second hydrograph shows the period leading up to the flood from mid-July. The flood on August 3rd occurs very suddenly after a dry period of about 10 days.


The last catastrophic flood of this magnitude, which also caused severe channel aggradation and channel instability, occurred on 11 August 2005. For the near-future we expect that it will be very difficult to monitor discharge accurately for a period of months or years as the channel adjusts to the huge pulse of sediment which has been introduced by this event. Extreme channel instability means that the rating curve is constantly shifting, so there are large errors in estimating discharge from river stage.


Tuesday 15 March 2022

Intensive snow survey no. 4

Active forest thinning of cedar stands at Takiya River

This winter we are undertaking intensive snow surveys from the season of peak snow accumulation to the spring melt-off. Our objective is to investigate the influence of forest canopy characteristics on snow accumulation and melt, and in particular to compare varying levels of thinning in cedar stands.

Below you can see a summary of the results from the first four surveys. Melt season is now well underway in most study plots, although surprisingly it seems the forest opening plot is still maintaining the peak level for snow water equivalent (SWE). The larch plot has been surveyed during more than 20 years, and this year shows a peak value of SWE which is the second highest on record.


The fall of a freshly cut cedar tree is cushioned by the deep snowpack

Rain-on-snow conditions bring the first high flows of this winter-spring season


Friday 14 January 2022

New paper published on baseflow recession analysis


Citation: Andrew C. Whitaker, Stanley N. Chapasa, Cristencio Sagras, Uwitonze Theogene, Ronald Veremu & Hironobu Sugiyama (2022)
Estimation of baseflow recession constant and regression of low flow indices in eastern Japan,
Hydrological Sciences Journal

DOI: 10.1080/02626667.2021.2003368

Free access (limited time) available here:

https://www.tandfonline.com/eprint/M53RUZEPVEDISGCM6TAY/full?target=10.1080/02626667.2021.2003368

ABSTRACT

We propose a convenient procedure for the matching strip method in determining the recession constant of the master recession curve using the ratio of flow over successive days (Qn+1/Qn). The method is applied to 29 basins (6.1–740 km2) in eastern Japan to develop linear regression models that estimate low flow indices through the recession constant (λ), and either mean annual precipitation or mean annual runoff. Significant models were developed for Q710 (seven-day 10-year low flow), and Q9710 (10-year low flow exceeded 97% of the time) in the case of all basins, and in particular for basins classified into sedimentary or igneous geology (adjusted R2 up to 0.784). When basins were not classified by geology, models based on mean annual runoff as the second independent variable performed better than those based on mean annual precipitation, with adjusted R2 values of 0.705 and 0.717 for the Q710 and Q9710 models, respectively.

-------

The article includes data from Takiya River along with data from 28 other basins in eastern Japan to propose and test a new variation on the matching strip method of estimating the baseflow recession constant. The baseflow recession constant is then used in regression modelling to estimate low flow indices.

A simple spreadsheet procedure to determine the master recession curve and baseflow recession constant is included in an appendix.

The location figure from the article, which includes 29 basins.