Friday 21 June 2019
Site check after June 18 Niigata/Yamagata earthquake
No visible impact at the gauging station after the recent earthquake of 18 June (22:22). Heavy rains over 16-17 June caused a moderate size flood, with peak stage just less than 1.0m. Some snapshots of the flood taken from the time-lapse camera below:
Wednesday 5 June 2019
Staff gauge renewal
Today's main task was to renew the staff gauge installation and sensor pipe for the original sensor/logger system (Druck sensor with Kadec logger housed away from the channel in a logger box). In particular the transducer sensor pipe had been in the river since August 2000, so nearly 19 years! The accumulation of sediment inside the sensor pipe meant that it was extremely difficult to remove the sensor and sensor cable from the pipe. Eventually, by rinsing the inside of the pipe with water and prodding with a long slender branch, we were able to free it. We could have damaged the sensor cable by pulling on it, though a brief test indicated it seemed to be functioning okay. The new sensor pipe does not have holes drilled in it like the old one, so it should not fill with sediment so easily. The holes seem to be unnecessary to correctly measure the water pressure in the river at the end of the sensor pipe.
The conditions were good for our work, with water level very low and stable at 0.306m. The elevation of the top of the staff gauge was levelled against a benchmark (100m), and the new staff gauge installed at the same height (99.641m). The two vertical pipes in the river were maintained as they were not easily removed and appear to be very secure (changed previously in 2008). The secondary backup sensor/logger system (Onset Hobo) was reinstalled in the same position behind the staff gauge, snug beneath the pipe clamp, as in the photo below.
Future work is needed to adjust the amount of slack in the sensor cable (spare coils located in the logger box), and to protect the cable hose where it exits the sensor pipe to give it support against snow loading in the winter (see below).
The following two photos show the location of the bedrock benchmark, marked by a white pebble.
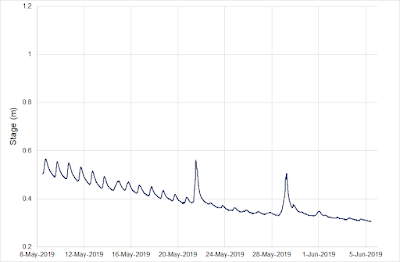
The hydrograph below shows the tail end of the snowmelt season during very dry conditions with only two minor rainfall events. See how the diurnal snowmelt signal (sine wave pattern) gradually fades out by the end of May.
Subscribe to:
Posts (Atom)


