Monday 16 December 2013

Soil temperature patterns


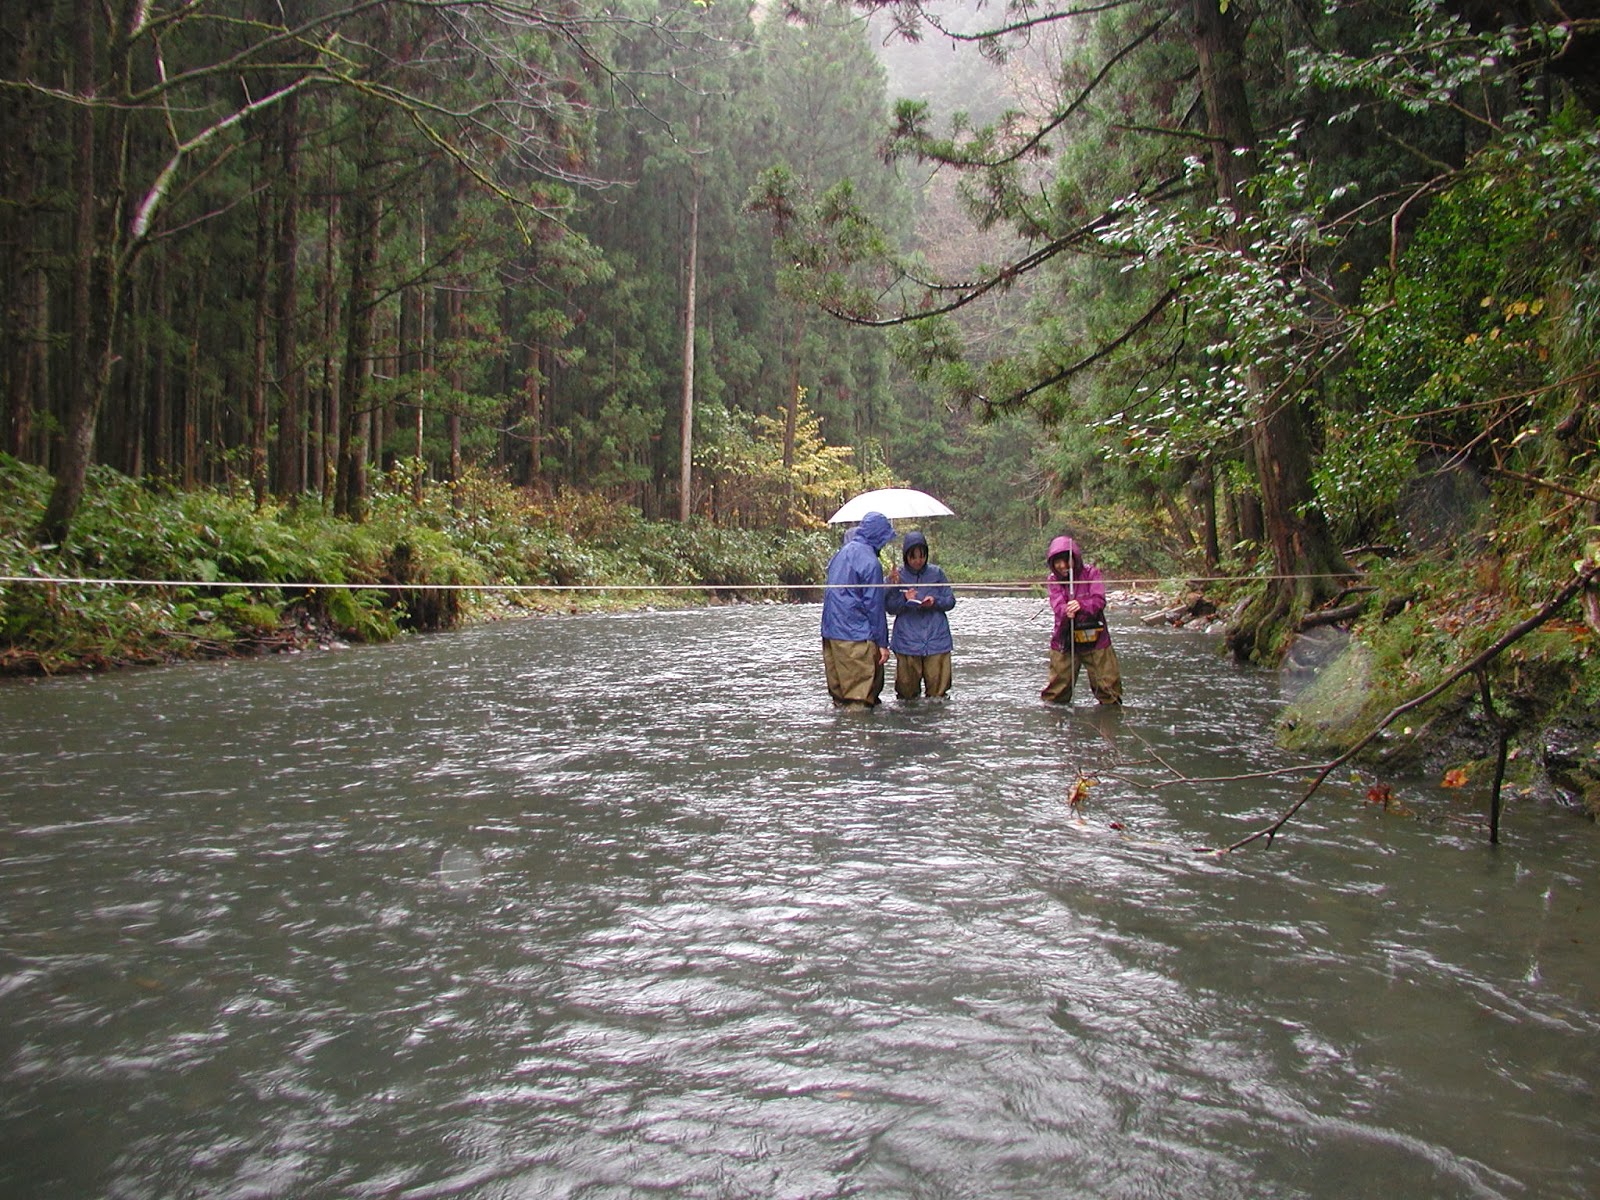
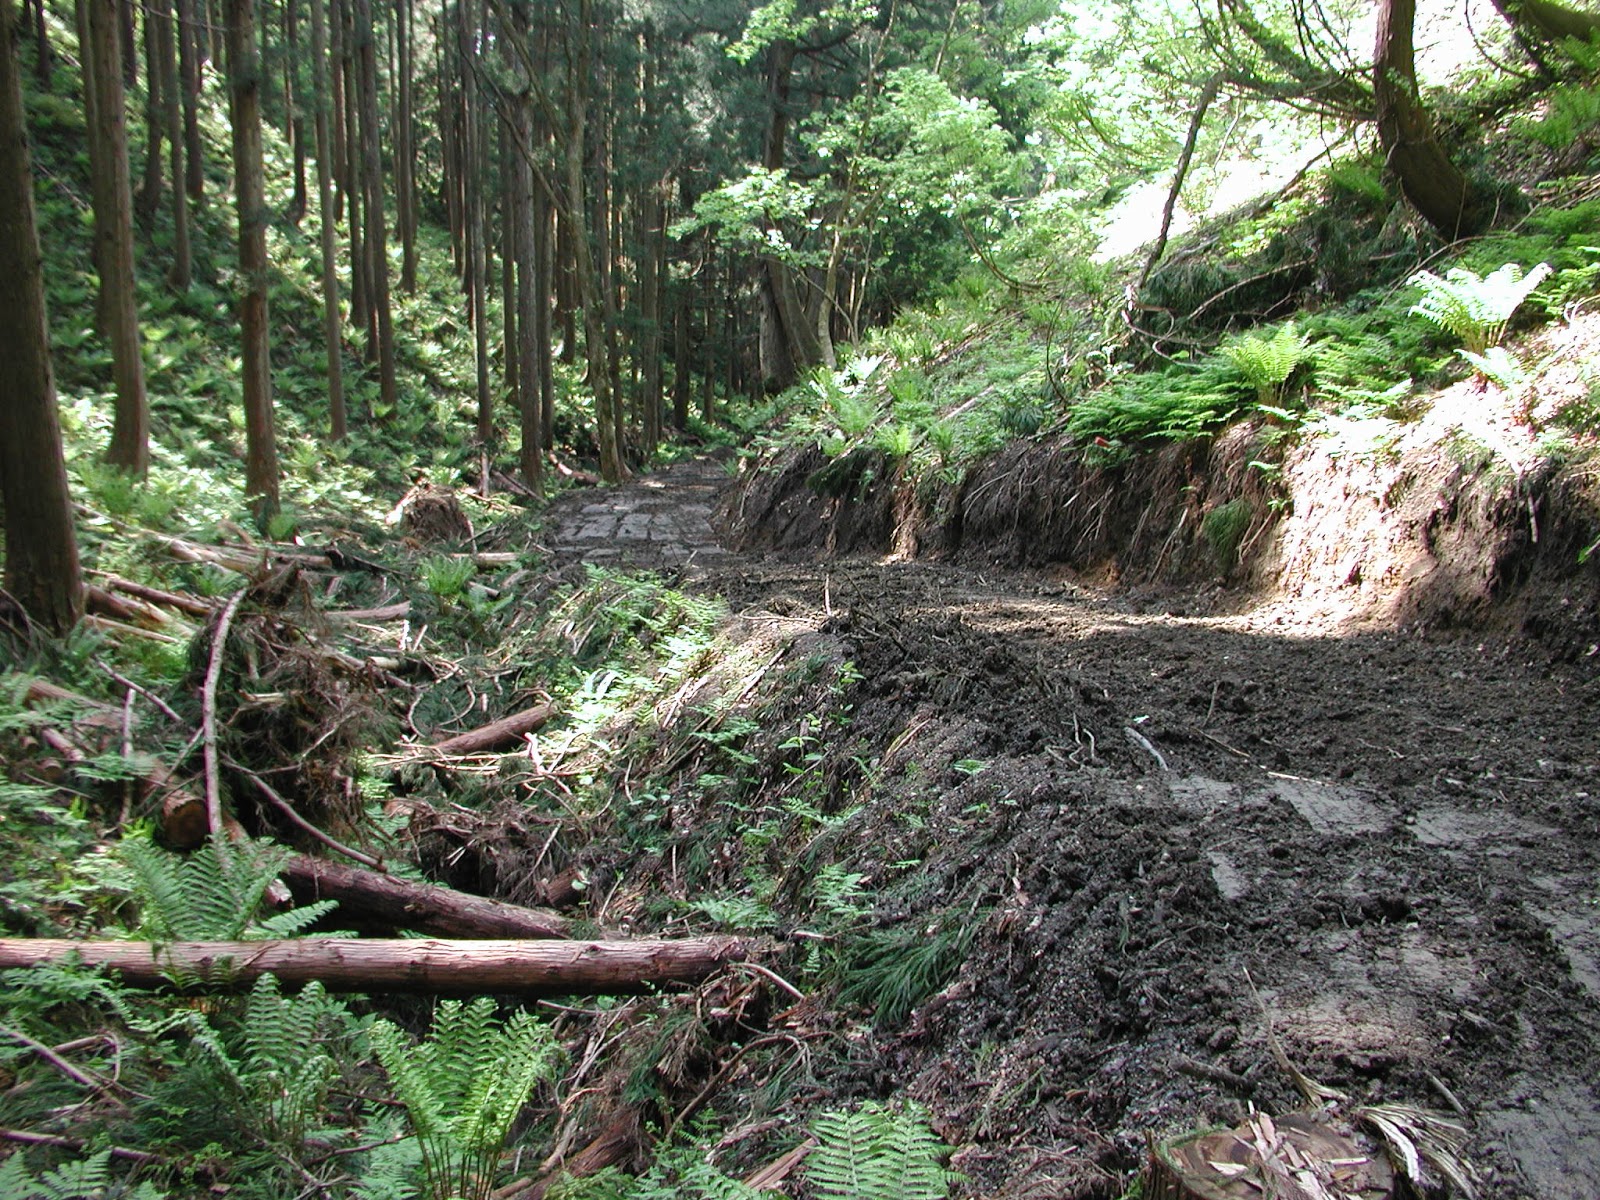
Today we had two main jobs: (1) cleaning and setting up the snow lysimeters for the coming winter season, and (2) visiting the zero-order basin to download the soil temperature data.

Above you can see the data for soil and spring water temperature for a period of three years obtained about 10 years ago. The seasonal pattern is clear, with stronger fluctuations in soil temperatures nearer the surface, and we can also see the impact of the seasonal snow cover very clearly during December to April. The sudden rise in soil temperatures in spring can only occur after the snow cover has melted off.

Also plotted in the figure above is the spring water temperature, which has a smaller range of variation compared to the soil temperatures, ranging only between about 9.5 and 13 degrees Celsius. This is because the spring water is flowing out from much greater depths where ground temperatures are almost constant year-round at approximately the mean annual air temperature.

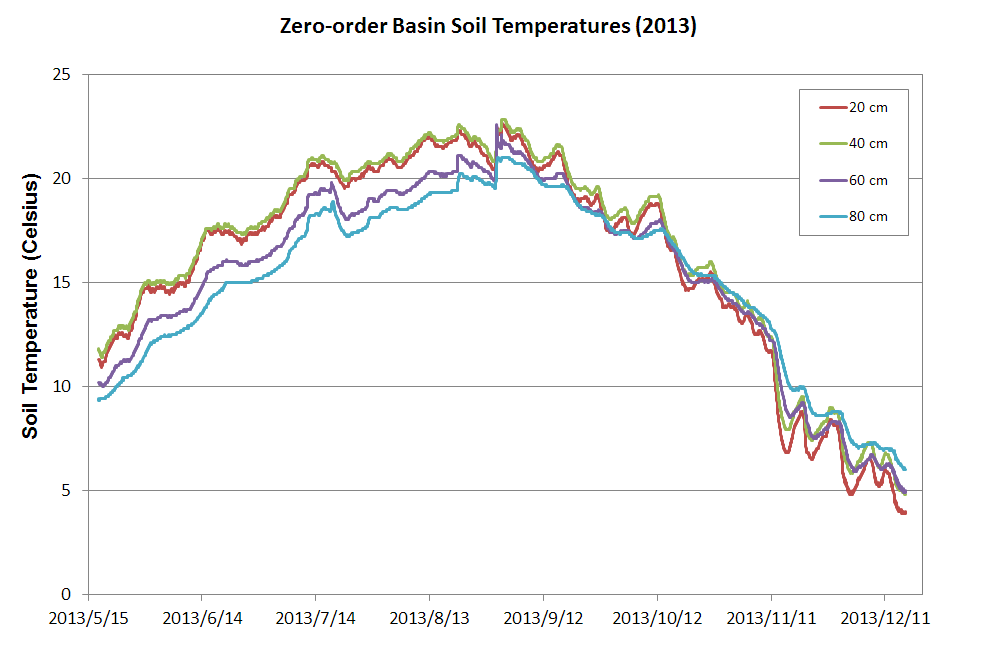
Below you can see the data downloaded for May to December 2013. During the summer season the temperatures nearer the surface are normally warmer due to the influx of energy with warmer air temperatures. However, the chart here shows the 20 cm and 40 cm depths to have almost the same temperatures, with the 40 cm depth even a little warmer. As the monitoring has been ongoing for over 10 years now, I suspect that the sensor wires have been subjected to stresses and movement within the soil column, causing problems with data reliability. The 100 cm depth data was suspect and removed from the chart. It is time to renew and re-install the monitoring equipment.


Monday 25 November 2013

Autumn rains gather pace


The autumn rainy season has got into full swing over the past month as you can see in the hydrograph above. November 20th shows a peak stage of around 90 cm after about 120 mm of rain fell over 2 days with intensities up to 11 mm/h. Stage is likely to remain at around 60 cm or higher until the winter snows arrive next month.

Weather conditions during today's survey were cloudy and relatively warm at 14 degrees C in the afternoon. After measuring the river discharge, we prepared for the winter season by cleaning the snow lysimeters and charging the winter precipitation gauges with antifreeze.

Stage = 62.5 cm, Ta = 9.9 C, Tw = 10.3 C

Monday 11 November 2013

First blast of winter

Stage = 59cm, Ta = 5C, Tw = 10C

December-like conditions today as heavy rain and sleet sweep in with strong winds. The air temperature in Murakami on the coast is just 3 degrees C, so the mountains will have been getting their first big accumulation of snow. Air temperatures were around 5 degrees at the gauging point, and with water temperatures around 10 degrees it made for very cold conditions to take a discharge measurement.

Tuesday 22 October 2013

New Water Year


The new water year starts on October 1st. Generally soil water and ground water levels are low at the end of the summer season, and it is convenient to start the new water year when storage in the basin is low and similar from year to year. During October the autumn rains arrive, and as temperatures drop, the levels of ET decrease and streamflow levels rise. Look at the hydrograph above and see how the low flows between the rainy peaks are increasing through October.

Taking a discharge measurement in light rain

Landslip zone upstream from the gauging point which supplies fine sediment

Friday 4 October 2013

Fine autumn weather


The past two weeks have been almost continuous sunshine, with very little precipitation. You can see from the hydrograph above that discharge has been steadily decreasing, although 18mm of rain fell on the 3rd October giving a small blip. Flows now are close to the yearly minimum flows. But the autumn rains are on the way soon, and as the temperatures cool then evapotranspiration decreases. This leads to more water in the river as runoff as we go through autumn.

Stage = 36cm, Ta = 15.6C, Tw = 14.5C

Friday 20 September 2013

Introducing our field site

Stage = 41.5cm, Ta = 21.1C, Tw = 16.2C

Today two of my students and I introduced our field site to two 3rd year students who are considering their options for their final year research project. If they decide to join my lab, they can enjoy field work at Takiya River over the next year and a half or so. I explained the basics of why we are monitoring the hydrological cycle at Takiya River, and they tried their hands at making a discharge measurement for the first time.

We also visited nearby Miomote Dam, and the Amedas meteorological station at Miomote. The hydrograph below shows a small peak in flow caused by rains from Typhoon no. 18 which passed over Niigata on September 16th. There was no damage from flooding in Niigata Prefecture, but other parts of Japan suffered major floods and landslides.


Thursday 12 September 2013

Late summer rains

Stage = 45.5cm, Ta = 20.8C, Tw = 16.6C

Today was another wet day for fieldwork, but we took the usual discharge measurement and inspected everything to check for any damage during the past 6 weeks. As you can see in the hydrograph below, the first two weeks of August were very dry, but since then there have been several rain storms and wet days. However, these events were not as large as the rain storms we had during July. A low flow of less than 40cm stage was recorded in mid-August, but this is not as low as the flows we had during June before the rainy season arrived. The record-setting rains during July have raised the groundwater levels so that we are unlikely to have very low flows this month.

Tuesday 30 July 2013

Record setting rains

Stage = 53cm, Ta = 19.9C, Tw = 15.5C

This July is already the wettest month on record for the Miomote Basin region. Today was another rainy day of fieldwork, but at least the river level was not so high and we could take a discharge measurement.

July is not yet over, but already an incredible 837mm of rain has fallen at Takane, and 628mm has fallen at Miomote. Since 1978, the wettest month was previously 629mm (Takane) and 520mm (Miomote), so we can see that the precipitation this month has been way above these past amounts which were recorded in November 1985.


Friday 19 July 2013

Major flood

Stage = 82cm, Ta = 19.7C, Tw = 14.4C

Yesterday we had a major flood at Takiya River, with stage reaching 1.8m and discharge estimated at 60m3/s (basin area is 19.45km2). Over July 17-18, 127mm of rain fell on already saturated ground, with a peak intensity of 35mm/h. Under these conditions flash floods often occur at Takiya River with stage rising by as much as a metre in a matter of minutes. The hydrograph below shows two other large floods during the past week, both of which exceeded 1.4m in stage.


Unfortunately the depth and velocity of the flow was too high to allow wading of the river and so we could not take a discharge measurement. I have used a sounding weight and cable from the road bridge, but this method is hardly effective and prone to large errors. I need to investigate other methods and instruments to estimate peak flows at Takiya River.


Tuesday 9 July 2013

Rainy season arrives

Stage = 59cm, Ta = 20.3C, Tw = 15.8C

This year the rainy season is late in arriving in the Niigata region. The hydrograph below shows a series of rainfall events and peaks during early July. After the first peak, river stage quickly returns to low flow levels, but subsequent rains are more prolonged and we can see the baseflow levels between floods are rising as the soils become more and more saturated and groundwater levels rise. The river flow is swelled by a mix of warm surface runoff and colder deeper groundwater circulation which reduces the temperature of the river, and produces a mist above the water as the warm humid air condenses.


Friday 28 June 2013

Early summer low flow

Stage = 30.5cm, Ta = 21.5C, Tw = 16.1C

The snowmelt season is over for the Takiya River Basin, and now we are waiting for the rainy season to arrive and swell the flow in the river. The hydrograph below shows that there is a false start to the rainy season around 20 June, after which dry conditions return. Together with late summer in September, this time of year before rainy season has some of the lowest flows of the year.


Tuesday 4 June 2013

Tail end of snowmelt season


After 2-3 months of snowmelt and sustained moderately high flows, the past two weeks have seen a steady decline in stage. The snow-covered area has really decreased rapidly, and normally disappears by early June for Takiya River. Note the continued dry weather and diurnal snowmelt pattern, which contrasts with the single rainfall event of May 31st.

Today's special job was to use anti-rust paint on the logger boxes which hold the stage data loggers for Takiya River and the tributary. These steel boxes are highly rust resistent, but having been in the forest continuously for up to 13 years, some much needed maintenance was in order.

Stage = 38.5cm, Ta = 20.0C, Tw = 13.6C

Friday 17 May 2013

Diurnal melt pattern


During fine weather the daily fluctuations in air temperature strongly control snowmelt and the stream discharge as seen clearly in the hydrograph above. The level of flow in Takiya River remains high due to snowmelt. With continuing fine weather during the rest of May we expect to see these diurnal wave patterns becoming less pronounced and then disappearing altogether when the snowpack has fully melted off.

Stage = 56cm, Ta = 12.8C, Tw = 9.3C
Zero-order basin where soil temperatures are monitored (0-100cm depth) at 200m asl
New forest road has been carved out of this narrow valley (starting 2012) to allow a partial cut of the cedars

Tuesday 30 April 2013

Cool weather dampens snowmelt


Unseasonably cool weather put the brakes on the snowmelt season through late April. The peaks on the hydrograph below are more to do with rainfall events than warm weather snowmelt. This year it looks like the snowmelt season with continue well into May.

Friday 19 April 2013

Snowmelt season


The last month or so has shown consistently high river stage and discharge which is typical of the snowmelt season. The hydrograph given above shows that stage has been mostly between 60cm and 80cm with three peaks, the largest of which is at over 110cm. Rain-on-snow has been an important factor in generating these peaks, and the classic pattern of snowmelt diurnal peaks created during fine weather are not easily seen. Some snow remained at the higher elevation young cedar lysimeter site, but melt-off was complete for the other lysimeter sites.

Stage = 66cm, Ta = 5C, Tw = 6C

Mature cedar lysimeter site after melt-off

Larch lysimeter site after melt-off

Young cedar lysimeter site after melt-off

Tuesday 19 March 2013

Spring rain-on-snow

First major rain-on-snow event of the season. Stage = 95cm, water temp. = 5.3C.

Warm temperatures up to 11.6 C and intense rain showers (3.5 mm/h) through the night and during the morning of the 19th led to typical rain-on-snow conditions and a moderately high discharge in Takiya River (stage about 1m).


Two students and I completed a snow survey of three locations (deciduous larch, mature cedar, and open paddy field). The snow pack beneath the mature cedar remained much firmer and more icy compared to the other two sites, which can be explained by the different energy balance between sites. During such rain-on-snow events we would expect the net radiation balance and the energy brought by warm winds to be greater in the open and deciduous larch sites.

The larch site had the highest snow water equivalent (SWE) and the greatest snow depth. The paddy and mature cedar site had similar SWE, but the depth was less and the density higher in the paddy where liquid water content was particularly high at the base of the snow pack.

Snow depths (cm)
Paddy: 52
Cedar: 72
Larch: 88

Snow survey in the larch site

Tuesday 12 March 2013

Late winter

Snowmelt water is crystal clear. Stage = 58cm.
Takiya River stage hydrograph (Nov 2012 to Mar 2013)

Today I serviced all the snow lysimeters, and also downloaded the river water level data enabling me to plot the stage hydrograph for the entire winter season as above. This winter is notable for the absence of any large rain-on-snow events during January and February as cold conditions continued. Precipitation is predominantly snow from mid-December to the end of February. Warmer conditions early March have given two moderate peaks already. Interestingly, the winter minimum low flow of about 40cm stage is roughly the same as the summer low flow stage of last September. Generally we expect the winter low flow to be a little higher due to basal melt of the snowpack and minimal ET during winter.

We are just about to enter the snowmelt season, and mountain snowpacks reach their peak during the month of March, at least in the Takiya River catchment. I was surprised to see that the water level was already a little high at 58cm - likely due to rain-on-snow over the previous weekend, though a trace of new snow had also fallen.

Early this morning temperatures plummeted to -6.5 degrees C for the tributary young cedar site (coldest temperature recorded there all winter). Must have been even colder in the valley bottoms. Clear skies, low humidity and still conditions gave extreme radiative cooling overnight, but warm air moved in during the day and temperatures reached the teens. However, in the shady spots the snowpack remained frozen solid all day. Lots of fresh monkey tracks in the snow.

Larch lysimeter

Mature cedar lysimeter

Young cedar lysimeter

View towards Japan Sea (left) and Miomote River (centre) at about 300m asl

Same viewpoint looking north across lower part of Takiya catchment (right-hand peak about 640m asl)