Friday 26 December 2014

Heavy snow interception


Heavy snows have already fallen this month and today the forest canopy was filled with snow. Branches sagged under the weight of the snow, and some of the cedar trees were completely bent over under the snow load. Heavy snows can cause a lot of damage to cedar trees, especially younger trees. Below is a series of photos to illustrate the interception of snow in the cedar forest.


We also checked the precipitation accumulation in the winter precipitation storage gauges, and completed snow surveys at the locations of the snow lysimeters.

Winter precipitation storage gauge

Snow lysimeter at the larch site

Snow lysimeter at the mature cedar site

Snow lysimeter at the young cedar site

Friday 12 December 2014

Winter season prep


Winter season arrived early in December this year. Already significant snowfall by mid-month, and today we had to work hard to complete all the winter season preparations - cleaning and setting up the snow lysimeters and charging the winter precipitation storage gauges. We also took one more discharge measurement to check the stage-rating curve before the winter season really sets in.

Friday 28 November 2014

Bears about

Evidence of bear activity - digging for a bees nest

Mother and cub bears have been sighted this month in the vicinity of our gauging station. Today we saw evidence of bears for ourselves - digging under the cedar trees for what looked like a bees nest. It's the first time in 15 years of visiting this site that I've seen evidence of bears. This year there have been many incidents of bears coming down to villages and low elevations looking for food.

We carried out the usual discharge measurement and also explored some new locations in the tributary basin for potential snow survey sites, taking care to make enough noise to scare any bears away!


Friday 14 November 2014

Bedload sediment in action

Stage = 0.6m, Q = 3.37m3/s, marginal bedload movement visible

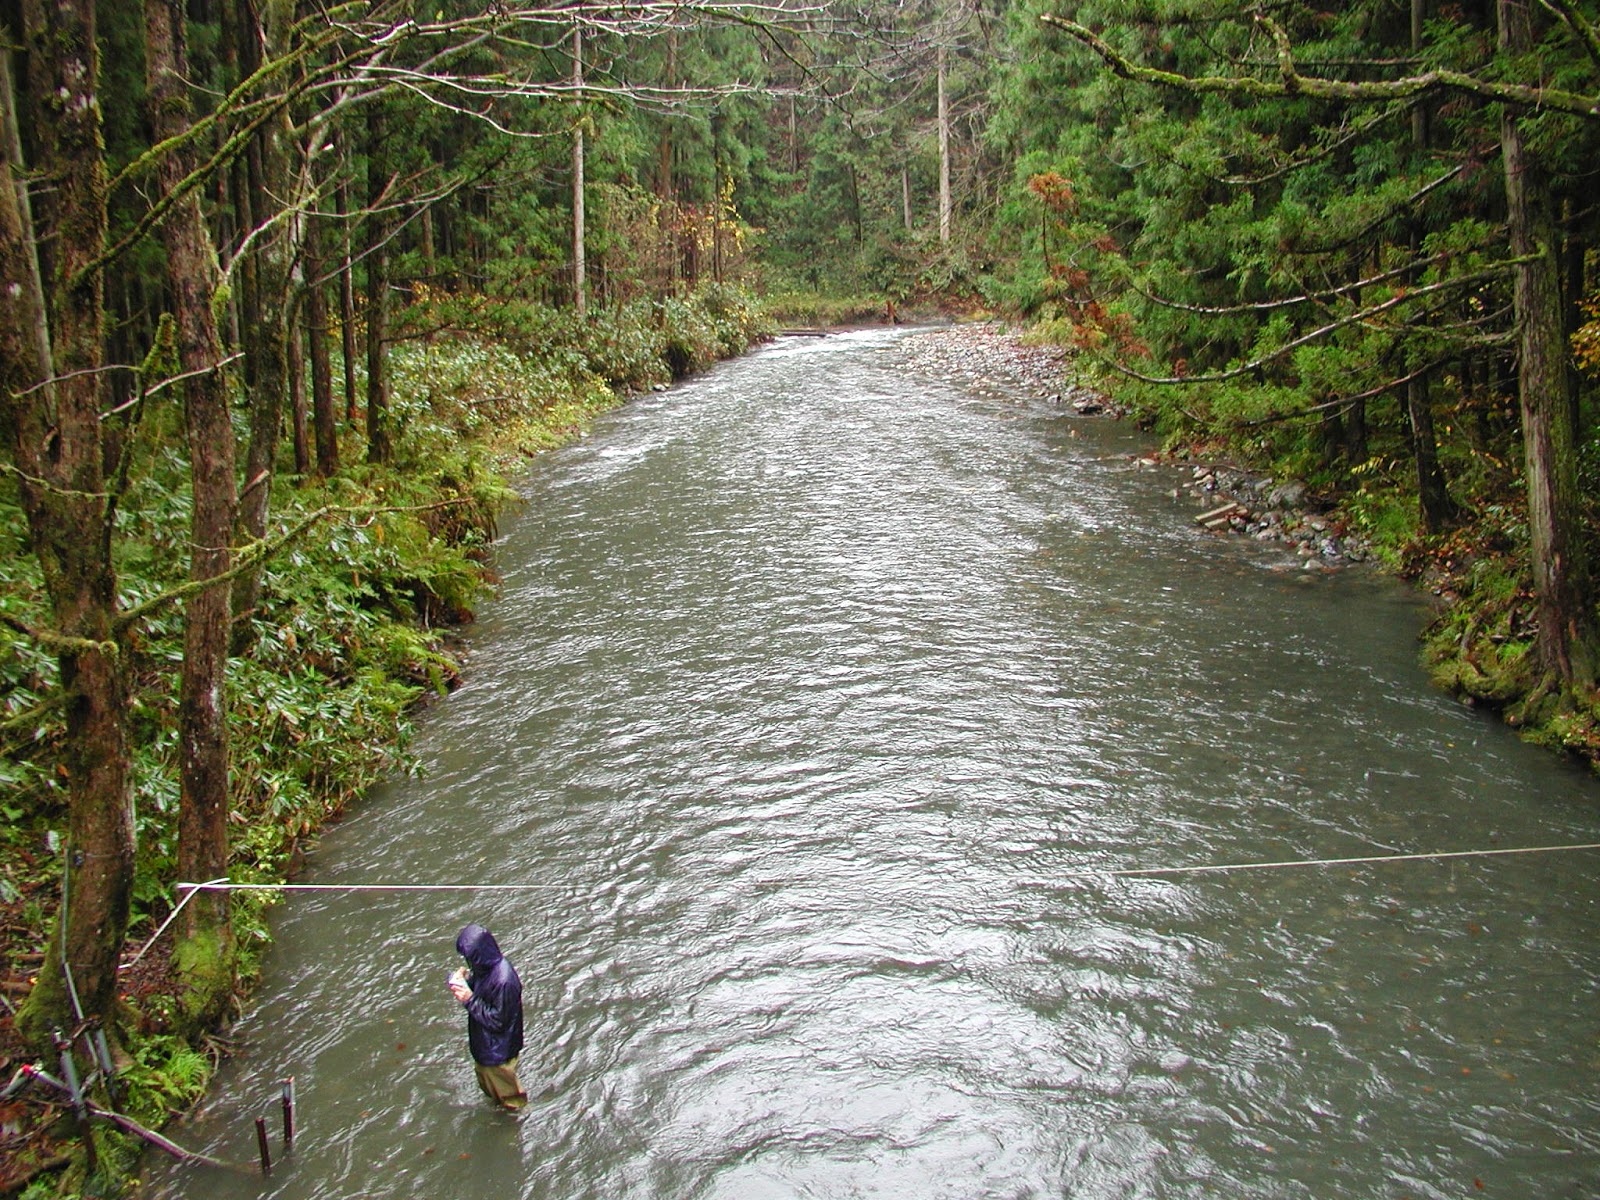
During today's discharge measurement, peak flow velocities reached about 0.9m/s, and the abundant supply of loose fine gravel on the stream bed was clearly moving in small jumps and bursts. We can assume flow conditions were close to the threshold of motion for bedload sediment. However, suspended sediment levels were low enough that the stream bed could be seen clearly.

We are now into the season of autumn rains where the frequency of rainy days increases, temperatures are dropping, and the soil water and groundwater storage levels are on the rise. This leads to a rise in the baseflow level of the river in between the peaks on the hydrograph. Not until we move into January and rainfall changes to mostly snowfall will the baseflow level begin to fall significantly.


Wednesday 5 November 2014

Washigasu Mountain

Washigasu Yama (1093m) from Maegadake (825m). The peak is still about 3km distant along the ridge.

Today was a team-building exercise to hike Washigasu Mountain, located just to the south of the Takiya River basin. A second objective was to take photos of the mountains and ridges of the Takiya River basin. The mountain name "Washigasu" means "Eagle's Nest", and the mountain is worthy of the name, being the highest peak (1093m) on a jagged ridge-line that rises steeply above the Miomote River. The total hike of 11.5km took us 8 hours on an arduous up-down and overgrown trail (ascent/descent 1675m).


Rising above Miomote Dam, the southern ridge-line of the Takiya basin (640m to 836m)

To the east, Asahi Mountain Range with fresh autumn snow (1870m)

Left centre is the upper Takiya basin (max. elev. 954m). Snowy Mt. Chokai (2230m) visible on the left horizon.

Rising above Miomote Dam, the southern ridge-line of the Takiya basin (640m to 836m)

Asahi Mountain Range from Nakagadake (1004m)

Nakagadake summit (1004m)

Miomote River and Miomote Dam are to the right

Summit of Washigasu Yama (1093m)

Summit of Washigasu Yama (1093m)

To the south, Iide Mountain Range (2100m) from Washigasu Yama

To the southwest, Niigata coastal plain stretches from Murakami to Yahiko

Our return route over Nakagadake (1004m) and Maegadake (825m) with lower Miomote River behind

Friday 31 October 2014

14 years of stream gauging

Stream gauging at Takiya River has been undertaken since 20th September 2000, so we have now accumulated over 14 years of invaluable data. I'm currently in the process of reconfirming the stage-discharge curves over this period, and I can now present the provisional hydrographs as below. Please enjoy!


Friday 17 October 2014

Autumn rains arrive


Today we worked in the rain, measuring the discharge at a moderately high stage of 56 cm. A maximum velocity of 0.91 m/s was recorded, and the total discharge came to 2.71 m3/s. We can see in the stage hydrograph below that a series of rainfall events has raised the baseflow water level as the catchment soil moisture and groundwater levels increase through the autumn season. Rainfall is becoming more frequent, and evapotranspiration is decreasing with falling temperatures.


Tuesday 30 September 2014

Annual minimum flow


The annual minimum flow to date occurred on 24 September after a dry period of 5 days. Stage dropped to about 31 cm which is approximately 0.4 m3/s (0.0206 m3/s/km2) on the current stage-rating curve. A rainfall event of 37 mm around 25 September was enough to raise the baseflow level of the river by about 4 cm. This year's precipitation has been more evenly distributed than average which means that the annual minimum flow is also relatively high.


Friday 19 September 2014

September low flows


The first 9 days of September were very dry (just 3 mm of rainfall on the 5th), and we can see the water level falling to only about 32 cm. This might be the lowest water level for the water year, also known as the minimum annual flow. Today we measured the discharge to be 0.45 m3/s at a stage of 34.5 cm. With a basin area of 19.45 km2, the specific discharge becomes 0.0231 m3/s/km2.