Wednesday 2 December 2020

Last survey of 2020

Before the winter season we always download the stage data from both the Kadec logger and the Hobo logger, and of course take a discharge measurement. Recent stage data from the Kadec logger plotted below shows two moderate peaks during November. The lower stage hydrograph compares the two logger systems for the second half of 2020. It seems there is greater discrepancy between them since October, with the Kadec data showing more noise during flow recession periods.


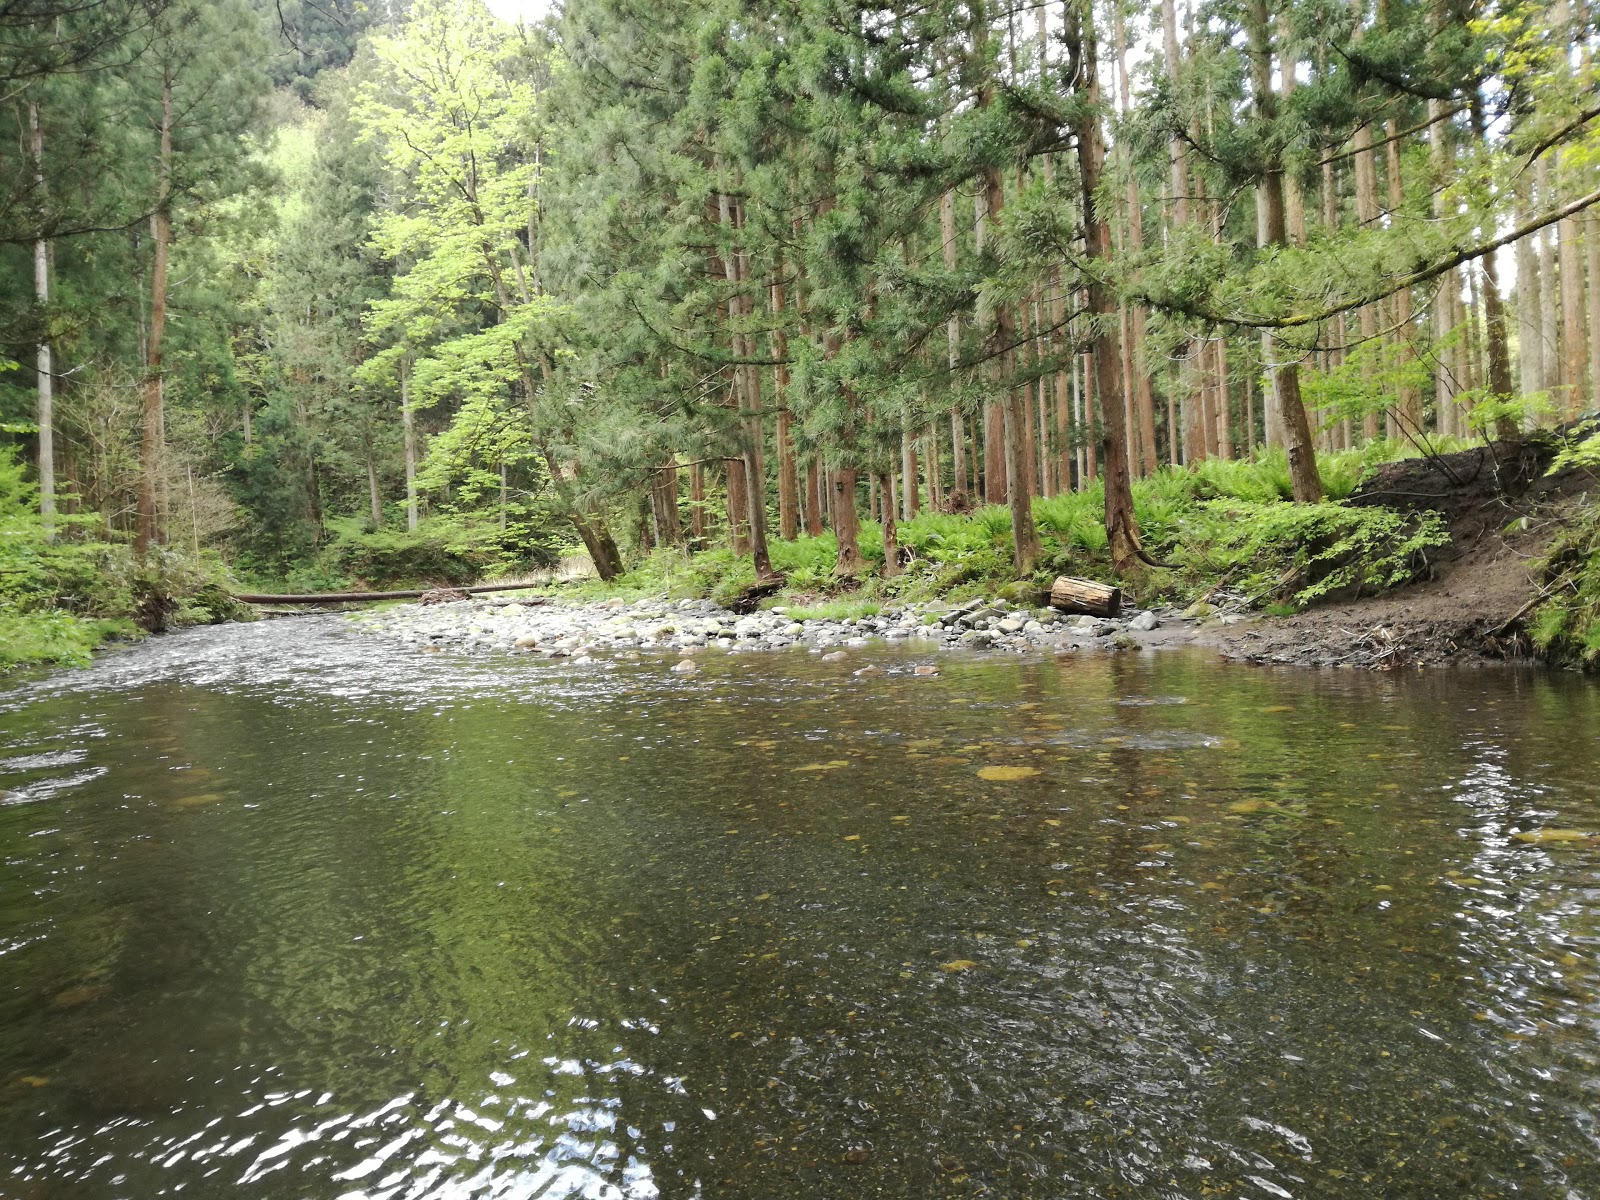
Recently thinned stand of cedar located very close to the gauged cross-section


Thursday 12 November 2020

Autumn rains and colours


Autumn rains sustained moderately high discharge through early November. It seems to have been enough to move the sediment pulse through the reach so that we are returning to the previous stage-discharge curve (before flood of August 1). Channel aggradation with fine gravel (due to a sediment pulse) often occurs in Takiya River after major floods, but this year the aggradation seems to have been quite short-lived.

We walked the channel up to a large landslip area about a kilometre upstream. This landslip is a major source of sediment for these sediment pulses which move downstream.


Thursday 29 October 2020

Establishing the new H-Q curve

Stage = 0.47m, Q = 0.90m3/s

Our second discharge measurement since the H-Q curve changed in early August due to channel aggradation. We need more measurements this autumn to be able to plot the new H-Q curve before winter arrives. The photos below show how the selective thinning of the cedar forest in the lower reaches of the basin has really progressed during this year.


Thursday 24 September 2020

Two major summer floods within 3 days

Stage = 0.437 m, Q = 0.615 m3/s

After an enforced break of 2 months, we finally managed to visit Takiya River to carry out a routine discharge measurement, and download both the stage recorders. The river channel seemed to be filled with an abundance of fine gravel, and indeed we found that the stage-rating curve had shifted to reflect this channel aggradation (higher stage level for a given rate of discharge).

Our previous visit (30 July) came just after a major flood on 28 July of stage 1.8 m, while a second major flood occurred soon after during 31 July to 1 August. Although both floods were of similar magnitude, the first flood was due to prolonged rainfall, while the second was due to very intense rainfall of short duration. At Takane Amedas gauge peak rainfall intensity reached 56 mm/h, and 71 mm fell over two hours. At Miomote Amedas gauge peak rainfall intensity reached "only" 19 mm/h, indicating the localized nature of the most intense rainfall.

These back-to-back floods appear to have introduced a larger amount of fine sediment to the channel than it can transport downstream, and hence the channel aggradation and shift in the rating curve.


Thursday 30 July 2020

Wettest month on record at >700mm


Stage = 0.705m, Q = 4.91m3/s (grey coloured suspended sediment is common after a large flood)


Much of northern Niigata Prefecture has recorded the wettest July and the wettest month ever recorded. So far the Miomote gauge has recorded 710mm and the Takane gauge 743mm this July. The previous wettest month for Miomote was 639mm in July 2013.

The wet weather culminated in a prolonged downpour over a 48-hour period during 26-28 July, when Miomote and Takane recorded 185mm and 206mm respectively. Maximum hourly precipitation was not so extreme, at 18mm/h and 26mm/h respectively. This resulted in a peak stage of 1.816m for Takiya River at 14:20 on July 28.

In measuring the discharge, we found a large accumulation of fine gravel in the channel with active bedload transport for this pea-sized gravel. The flow was especially shallow and with high velocity compared to our previous measurement on July 9 at similar stage.

Thursday 18 June 2020

Start of the rainy season

Stage = 0.345m, Discharge = 0.422 m3/s


The stage hydrographs above show the past two weeks (upper) and the past six months (lower). We have already had some heavy rain marking the start of the rainy season. The lower graph shows the high flows during winter compared to the low flows during April and May and into June. We cannot see the usual pattern of snowmelt runoff during March to May, due to the almost total absence of snowpack this year.

Tuesday 2 June 2020

Record low runoff for May

Stage = 0.336 m, Discharge = 0.352 m3/s


At a first glance today's discharge appears typical of early summer low flow conditions. However, May was much drier than normal with only 96 mm of precipitation (Miomote Amedas) compared to the 30-year average of 150 mm. In addition, we have just experienced record low snowpack for this past winter. The lack of precipitation during May, combined with the lack of snowmelt runoff, have produced the lowest recorded basin runoff for the month of May at just 111 mm (20-year average is 287 mm).

This follows directly after the record low runoff for April, and both these records can be attributed to the record warm temperatures and record low snowfalls this past winter.

Depending on the timing of the rainy season later this month, and the amount of rain it brings, we could be expecting record low flow conditions for many basins in Niigata region and other parts of Japan.

Friday 8 May 2020

Record low runoff for April

The provisional estimate for April runoff is just 240 mm, which is a record low by a large margin.

April runoff is very important as in almost every year April runoff is the greatest of any month, and it coincides with the planting of the rice paddies at the end of April to early May when demand for agricultural water resources is high.

Year    April runoff (mm)      Comment
2020          240                       Lowest on record (since 2001)
2019          348                       2nd lowest on record
2018          617                       4th highest on record
Note: Average April runoff (2001-2019) is 500 mm.

The table above shows April runoff for the last three years. The two lowest April runoff values have occurred in the last two years, and this year's record low is a full 108 mm lower than the previous record low, and less than half the average value of 500 mm.

Lack of seasonal snowpack is the main reason for these low April flows. April precipitation was actually a little above average at both Miomote and Takane (168mm/198mm compared to averages of 149mm/171mm respectively) and so cannot explain these low flows.

Thursday 7 May 2020

Diurnal snowmelt pattern absent

Stage 0.404m, discharge 0.801m3/s within 2% of the rating curve estimate

With the coronavirus pandemic the university has severely restricted student research activity and fieldwork. Today I visited the field with family support to allow us to continue to check up on the monitoring and collect a new discharge measurement. We confirmed there has been no change in the rating curve.


The hydrograph above shows little if any diurnal snowmelt pattern, due to the extremely low snowpack conditions this winter and spring. Two significant rainstorms produced modest runoff peaks which would have been much larger with additional snowmelt contributions had there been snowpack.

Date               Event precip. (mm)    Max intensity (mm/h)
1-2     April               40.5                              5
18-19 April               52.5                              6

Overall, runoff for the month of April appears much less than average (provisional data under preparation).

Takiya below gauging point - right bank disturbed by recent logging activity

North of the Takiya basin, the Asahi Mountains (1870m) still snow-covered as viewed from Washigasu Maenodake (825m)

Tuesday 31 March 2020

Winter stage data download

31 Mar: Runoff is 7.02 mm/day

Today I downloaded both the stage loggers (Kadec, Hobo) to evaluate the winter season runoff. The hydrograph below shows that there are multiple peaks due to the high frequency of rainfall and the absence of any significant snowfall in the basin this winter. Winter rain-on-snow is not unusual for this basin, however, the hydrograph below shows particularly high rainfall activity for winter due to the record warm temperatures. Even over the basin elevation range of 40-950 m, the dominant precipitation phase was rainfall.


Notable runoff events include:

Date                    2-day precip.   Max. intensity
8-9 January            74 mm              9.5 mm/h
16-17 February      50 mm              5 mm/h
10-11 March           39 mm              7 mm/h
27-28 March           41 mm              7 mm/h

The 52 mm of precipitation on 8 January tied with the record for the highest daily precipitation measured in January. The 9.5 mm/h maximum precipitation intensity was the second highest for January (since 1982).

Monday 17 February 2020

No seasonal snowpack this year

Niigata City and indeed much of Japan just had the warmest January since records began in 1882. The average January temperature during 1981-2010 was 2.4 degrees Celsius, while this year it was 5.2 degrees Celsius. The second warmest January on record was in 2007 with 4.9 degrees Celsius. Globally, January 2020 was also the warmest on record.

Location of snow lysimeter in larch stand near gauging station

Some snowfall occurred in early February, but most of that has already melted away at the low elevations. In 20 years of snow survey at Takiya River basin, this is the first time that there has not been a seasonal snowpack at low or even medium elevations (0-600m).

Stage about 0.8m at the gauging station

Strong warm winds and rainfall (8 m/s, 11.7 degrees Celsius, 51 mm) combined to produce rain-on-snow conditions and high runoff with some suspended sediment load. Even high elevations above 500m only retain patchy snow cover.

Forest harvesting activity near the gauging station (Japanese cedar, "Sugi")

Small mountain shrine about 2 km upstream of the gauging station