|
| Stage = 0.719m, discharge = 0.685 m3/s |
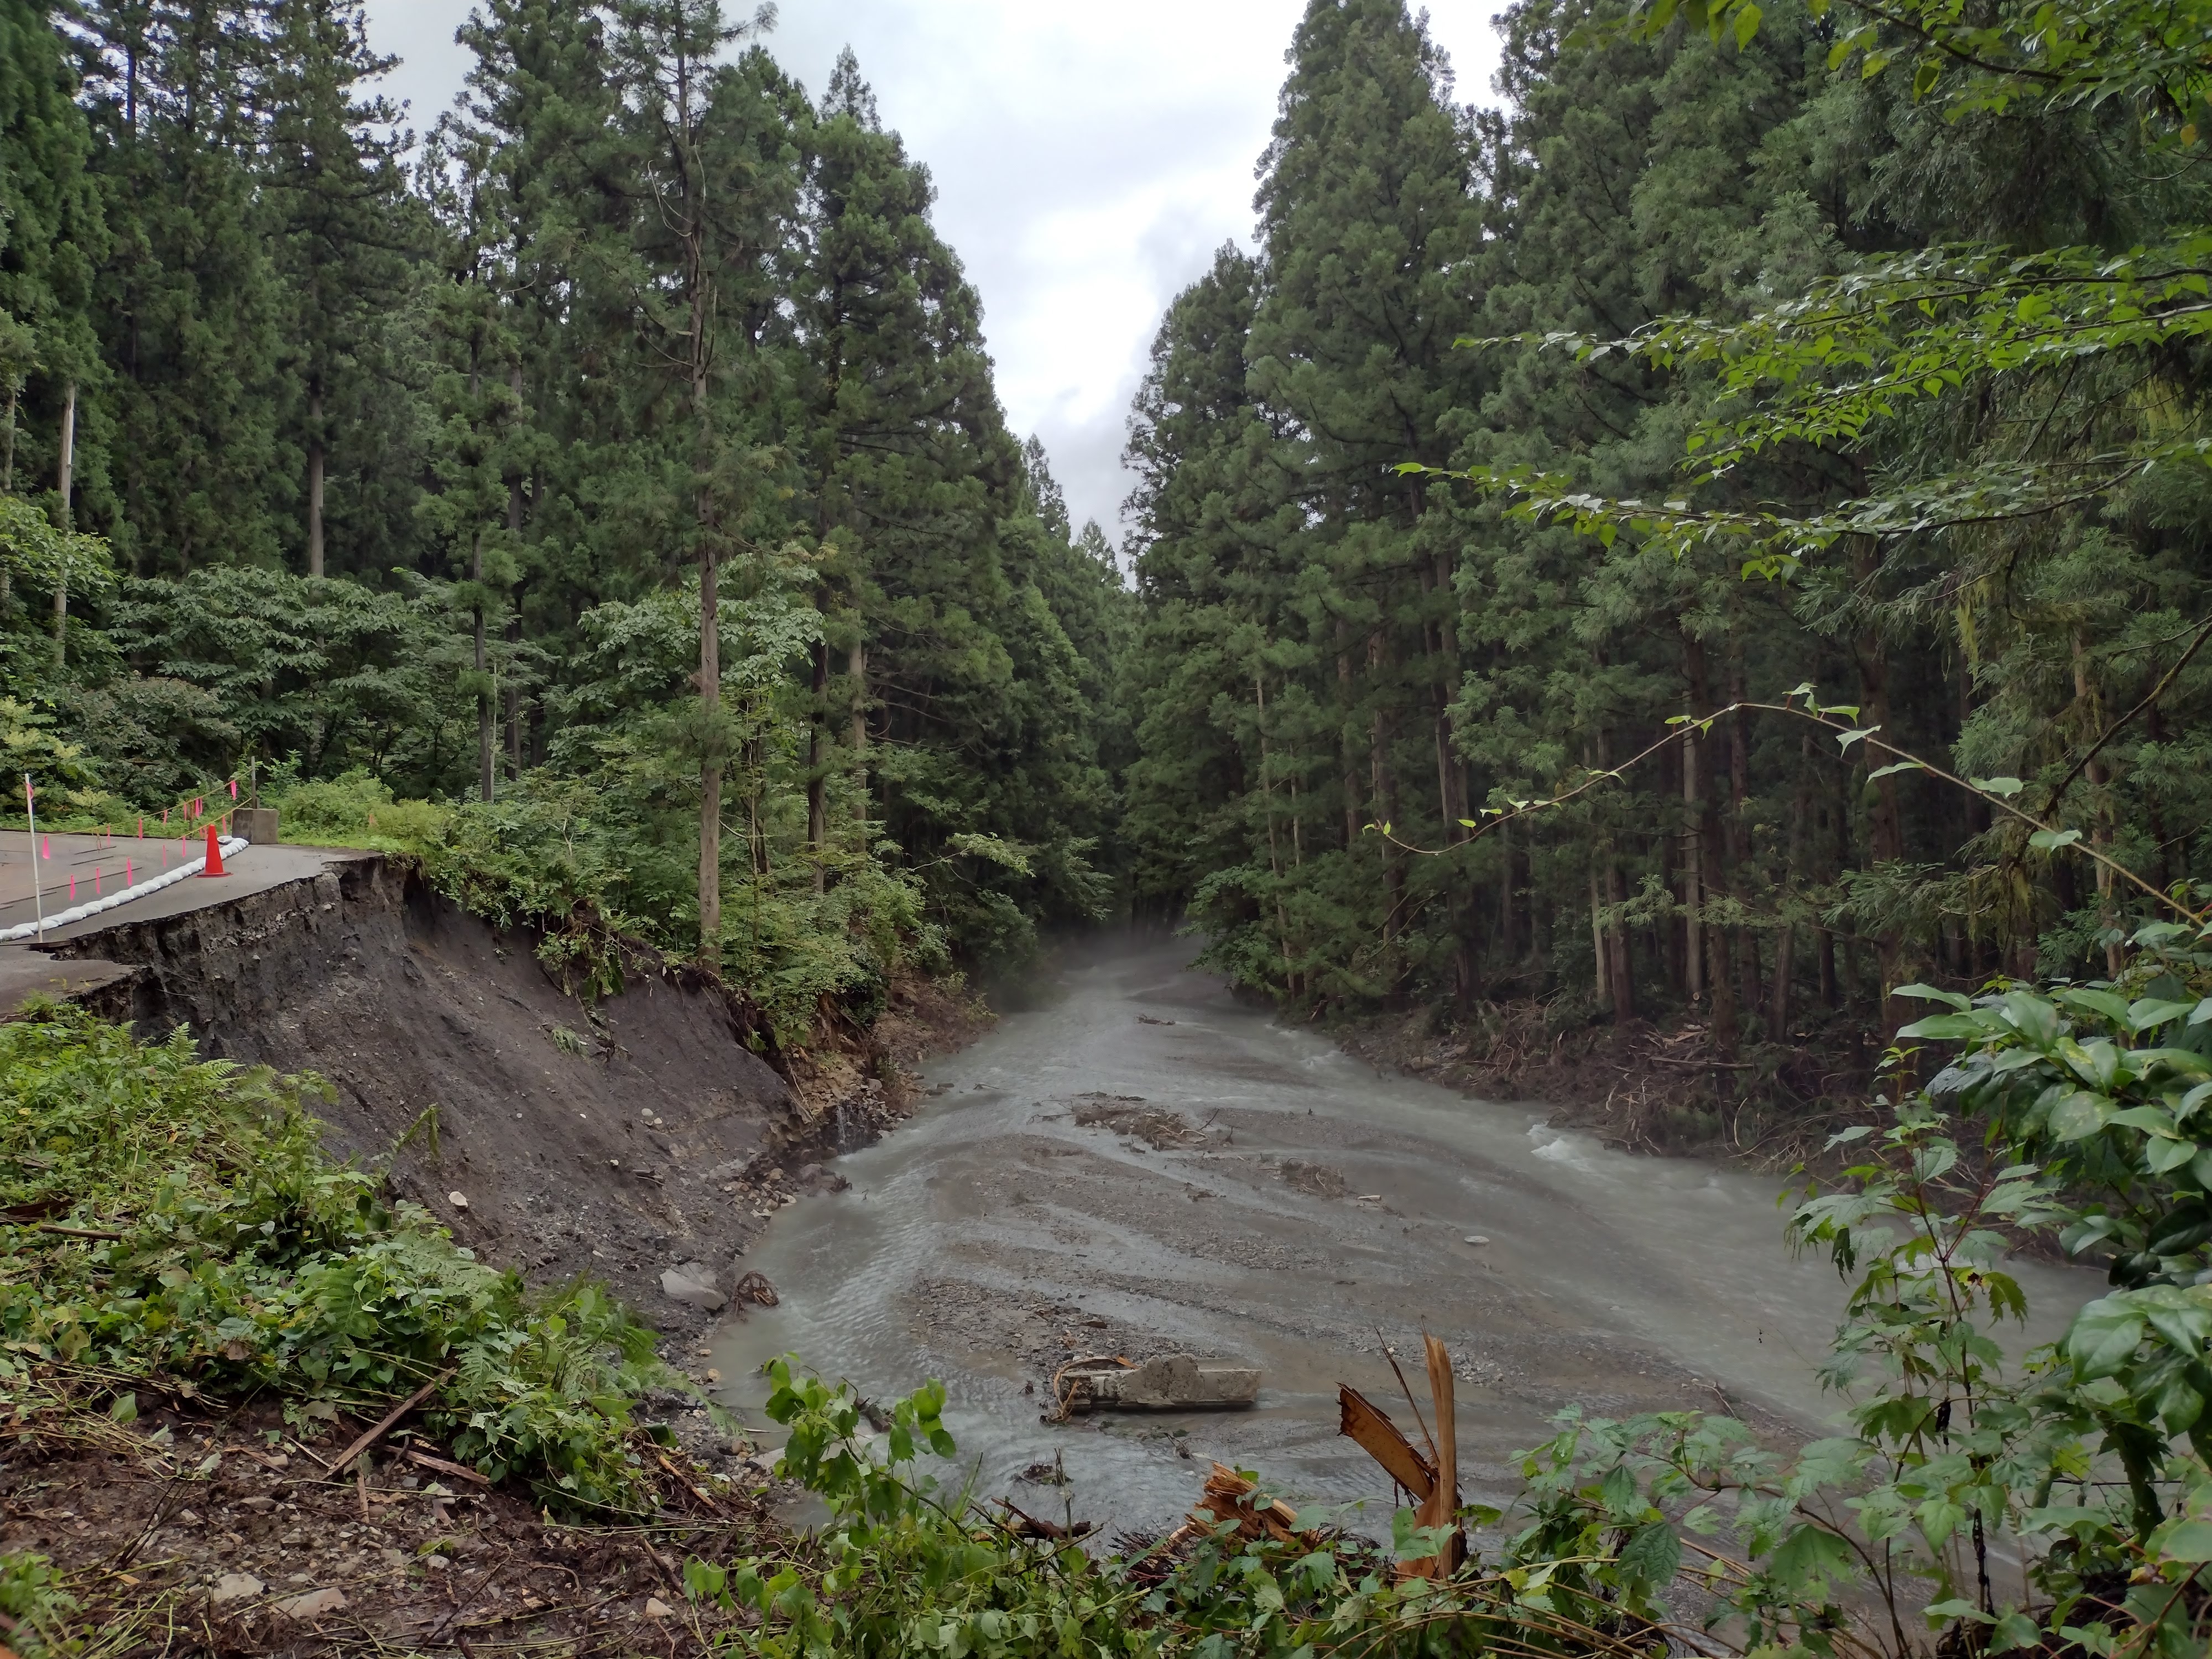
Today three of us made the trip to Murakami to check on the Takiya River monitoring site after a long break of about 18 months. Since the maximum flood on record of August 2022, the channel had been filled with huge volumes of sediment making the channel cross-section very unstable, and making it difficult to establish a meaningful stage-rating curve. So since the flood of August 2022 we have not been able to estimate the discharge hydrograph.
Seeing the condition of the channel today, it appears that the channel still shows high levels of aggradation due to sediment loading. It may still be challenging to establish a stage-rating curve but we will give it a go this year. New logger sensors were installed to monitor the water level and the atmospheric pressure.
 |
| Velocity, depth and discharge across the section (upstream view) |
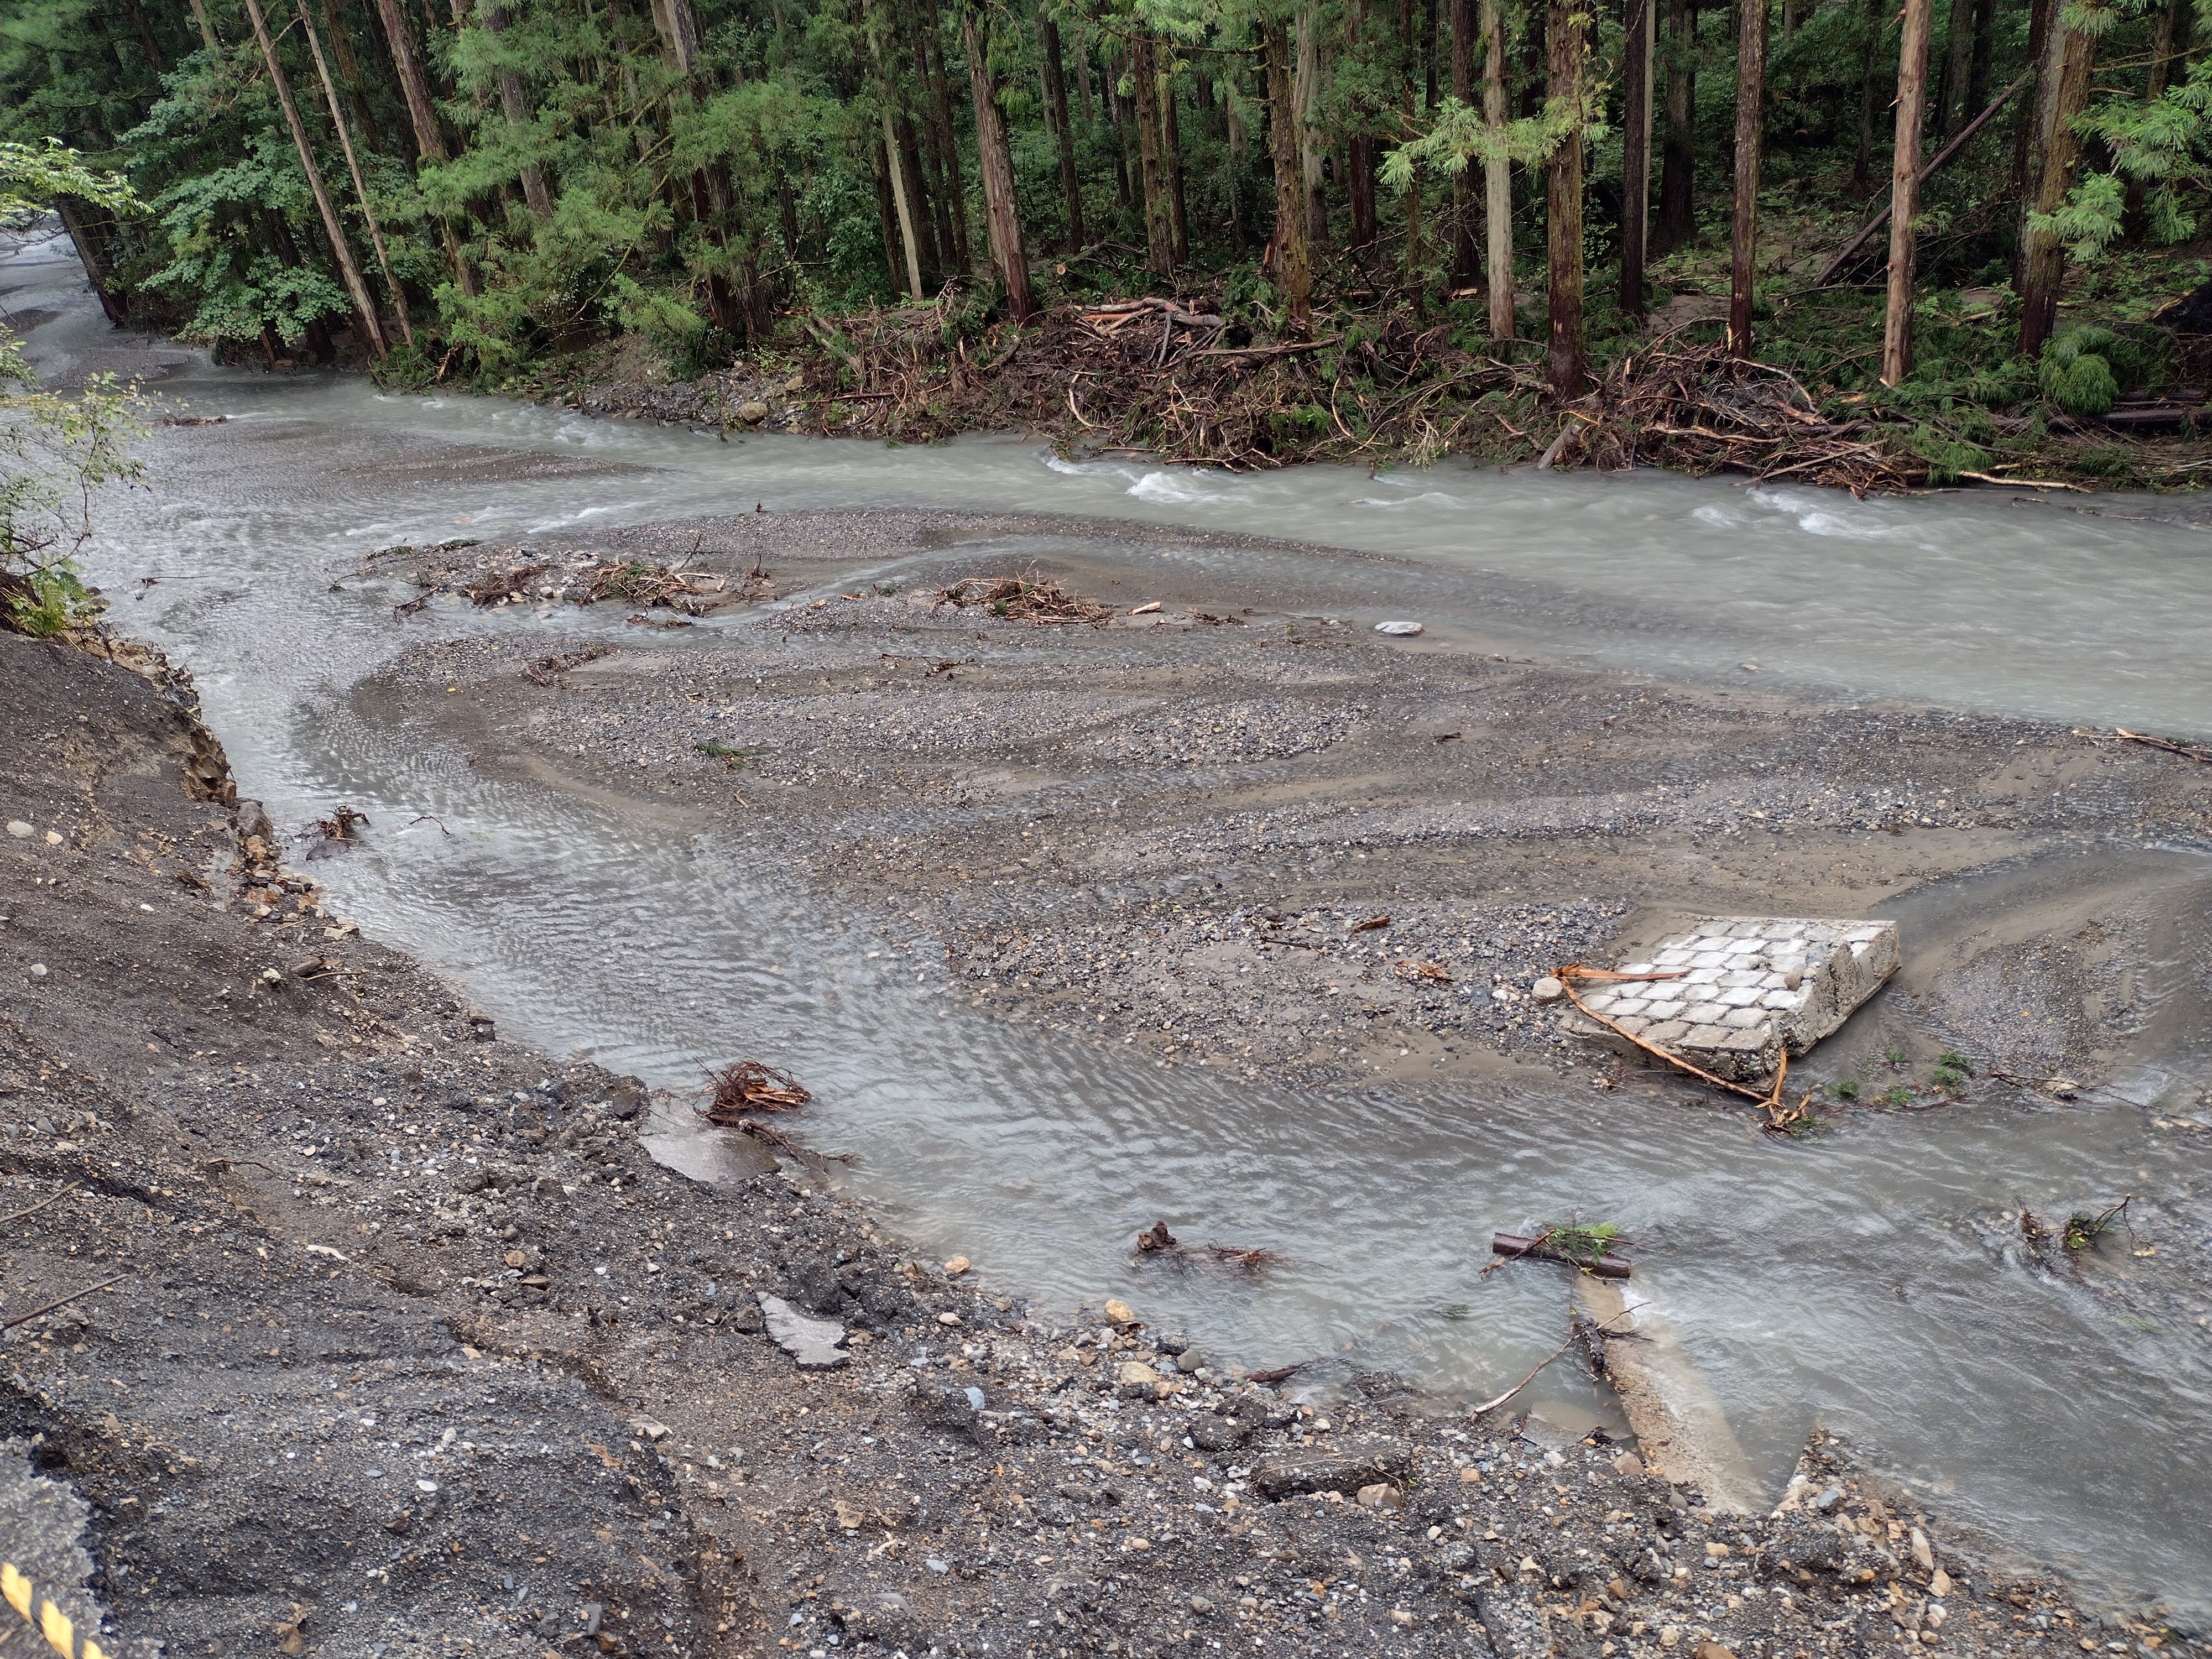
The stage data below was salvaged from the loggers recovered at the site. Significant flooding occurred on 15 September 2024 (flash-flood) and during 20-22 September 2024 when >330 mm of precipitation occurred at the Miomote Amedas gauge and hourly precipitation reached >70 mm/h. During this flood event it is evident that the channel degraded somewhat towards the pre-2022-flood level.


Hope to give you another update on the monitoring soon!