Friday, 19 March 2021

March snow survey


 The table above summarizes the snow survey data for this winter season. The snowpack was below-average, with a peak of 28cm of snow water equivalent (SWE) in the larch stand, or 21cm of SWE in the cedar stand. The ratio of SWE for larch/cedar is 1.33 which is quite typical. There was 33% more snow accumulation in the larch stand due to lower interception loss of snow in the deciduous canopy.

Record warm temperatures during March meant that the snow accumulation peaked very early. Between 3 March and 19 March the snow melted at twice the rate in the larch stand compared to the cedar stand due to differences in the energy balance. On 19 March we managed to make the final snow survey and the first discharge measurement of the 2021 season.

Photos from 3 March:

Larch stand

Cedar stand


Photos from 19 March:

Snowmelt season now in full swing


Cedar stand


Tuesday, 2 February 2021

Mid-winter Snow Survey


Our first snow survey this winter season. And our first in two years, due to the lack of snow last winter. This year is perhaps close to average conditions. Tough weather for our survey, with first rain and wind, and then wet snow. The rain-on-snow conditions caused the river to be high (about 0.7m stage), and muddy with sediment.

After much rain over the past couple of days the snowpack was very soft and wet in the larch stand. It makes it difficult to take a snow core sample as the lower end will easily break off. The cedar stand was still a little hard and icy in certain layers.


Snow densities were high for this time of year! About 0.35 for both sites. As we measure every year, the larch stand has deeper accumulation and higher snow water equivalent (about 25% higher than cedar) due to the reduced snow interception in the deciduous larch stand.


Larch stand

Cedar stand

Rain-on-snow conditions


Wednesday, 2 December 2020

Last survey of 2020

Before the winter season we always download the stage data from both the Kadec logger and the Hobo logger, and of course take a discharge measurement. Recent stage data from the Kadec logger plotted below shows two moderate peaks during November. The lower stage hydrograph compares the two logger systems for the second half of 2020. It seems there is greater discrepancy between them since October, with the Kadec data showing more noise during flow recession periods.


Recently thinned stand of cedar located very close to the gauged cross-section


Thursday, 12 November 2020

Autumn rains and colours


Autumn rains sustained moderately high discharge through early November. It seems to have been enough to move the sediment pulse through the reach so that we are returning to the previous stage-discharge curve (before flood of August 1). Channel aggradation with fine gravel (due to a sediment pulse) often occurs in Takiya River after major floods, but this year the aggradation seems to have been quite short-lived.

We walked the channel up to a large landslip area about a kilometre upstream. This landslip is a major source of sediment for these sediment pulses which move downstream.


Thursday, 29 October 2020

Establishing the new H-Q curve

Stage = 0.47m, Q = 0.90m3/s

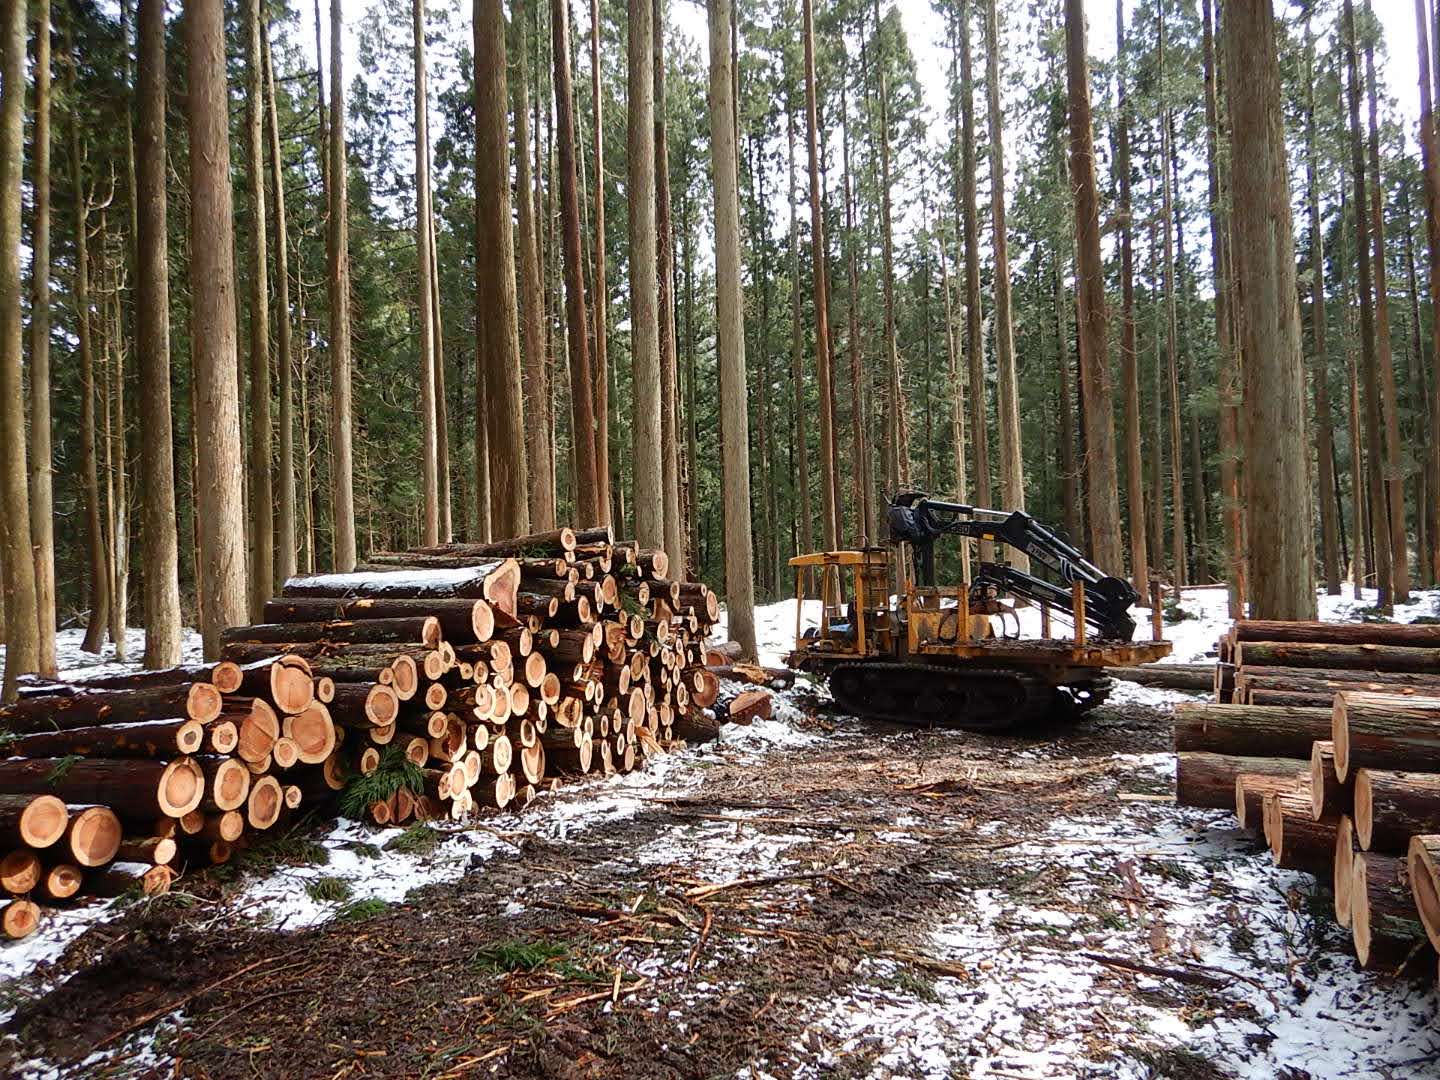
Our second discharge measurement since the H-Q curve changed in early August due to channel aggradation. We need more measurements this autumn to be able to plot the new H-Q curve before winter arrives. The photos below show how the selective thinning of the cedar forest in the lower reaches of the basin has really progressed during this year.


Thursday, 24 September 2020

Two major summer floods within 3 days

Stage = 0.437 m, Q = 0.615 m3/s

After an enforced break of 2 months, we finally managed to visit Takiya River to carry out a routine discharge measurement, and download both the stage recorders. The river channel seemed to be filled with an abundance of fine gravel, and indeed we found that the stage-rating curve had shifted to reflect this channel aggradation (higher stage level for a given rate of discharge).

Our previous visit (30 July) came just after a major flood on 28 July of stage 1.8 m, while a second major flood occurred soon after during 31 July to 1 August. Although both floods were of similar magnitude, the first flood was due to prolonged rainfall, while the second was due to very intense rainfall of short duration. At Takane Amedas gauge peak rainfall intensity reached 56 mm/h, and 71 mm fell over two hours. At Miomote Amedas gauge peak rainfall intensity reached "only" 19 mm/h, indicating the localized nature of the most intense rainfall.

These back-to-back floods appear to have introduced a larger amount of fine sediment to the channel than it can transport downstream, and hence the channel aggradation and shift in the rating curve.


Thursday, 30 July 2020

Wettest month on record at >700mm


Stage = 0.705m, Q = 4.91m3/s (grey coloured suspended sediment is common after a large flood)


Much of northern Niigata Prefecture has recorded the wettest July and the wettest month ever recorded. So far the Miomote gauge has recorded 710mm and the Takane gauge 743mm this July. The previous wettest month for Miomote was 639mm in July 2013.

The wet weather culminated in a prolonged downpour over a 48-hour period during 26-28 July, when Miomote and Takane recorded 185mm and 206mm respectively. Maximum hourly precipitation was not so extreme, at 18mm/h and 26mm/h respectively. This resulted in a peak stage of 1.816m for Takiya River at 14:20 on July 28.

In measuring the discharge, we found a large accumulation of fine gravel in the channel with active bedload transport for this pea-sized gravel. The flow was especially shallow and with high velocity compared to our previous measurement on July 9 at similar stage.