Saturday, 21 April 2018

Snowmelt season runoff


Stage = 57.25 cm, Q = 3.24 m3/s, Vmax = 0.94 m/s
Snowmelt season in full swing today with fine weather melt conditions. Stage starts to rise about 11am, and peaks about 6pm. Maximum velocities in the centre of the channel reaching nearly 1 m/s making it hard to hold the current meter in position. Unsteady flow and standing waves make it difficult to estimate the flow depth as it constantly fluctuates. However, despite the moderately high discharge level, the water remains extremely clear with no visible sediment load.


The hydrograph above shows a period of fine weather melt during late March where we can see the diurnal melt pattern rising day by day. In contrast, the larger and more abrupt peak flow on April 15 is a rain-on-snow event due to 54 mm of precipitation with a maximum intensity of 12 mm/h.

Thursday, 22 March 2018

Final snow survey


Final snow survey of the season today shows continuing melt through March. The snow melts twice as fast in the larch stand compared to the mature cedar stand due to the lack of shading and higher net radiation under the deciduous canopy without leaves.

Snow survey summary, snow water equivalent
Larch: 35 cm (down from 51 cm to 35 cm over 16 days = 1.0 cm/day)
Mature cedar: 28 cm (down from 36 cm to 28 cm over 16 days = 0.5 cm/day)


A discharge measurement was also taken under rainy and very cold conditions to confirm the stage-rating curve after the winter and before the main snowmelt season.

Stage = 57.25 cm, Q = 3.14 m3/s

Thursday, 8 March 2018

Log jam removal


Today's main task was to remove the log jam below the gauging station, in addition to downloading the Hobo water level recorder and resetting it under the water by the staff gauge. This was cold work in a stream swollen with snowmelt water. After removing the log jam, the water level immediately dropped by about 55 mm at the gauging station, confirming a backwater effect which had been influencing stage measurement.


Tuesday, 6 March 2018

March snow survey


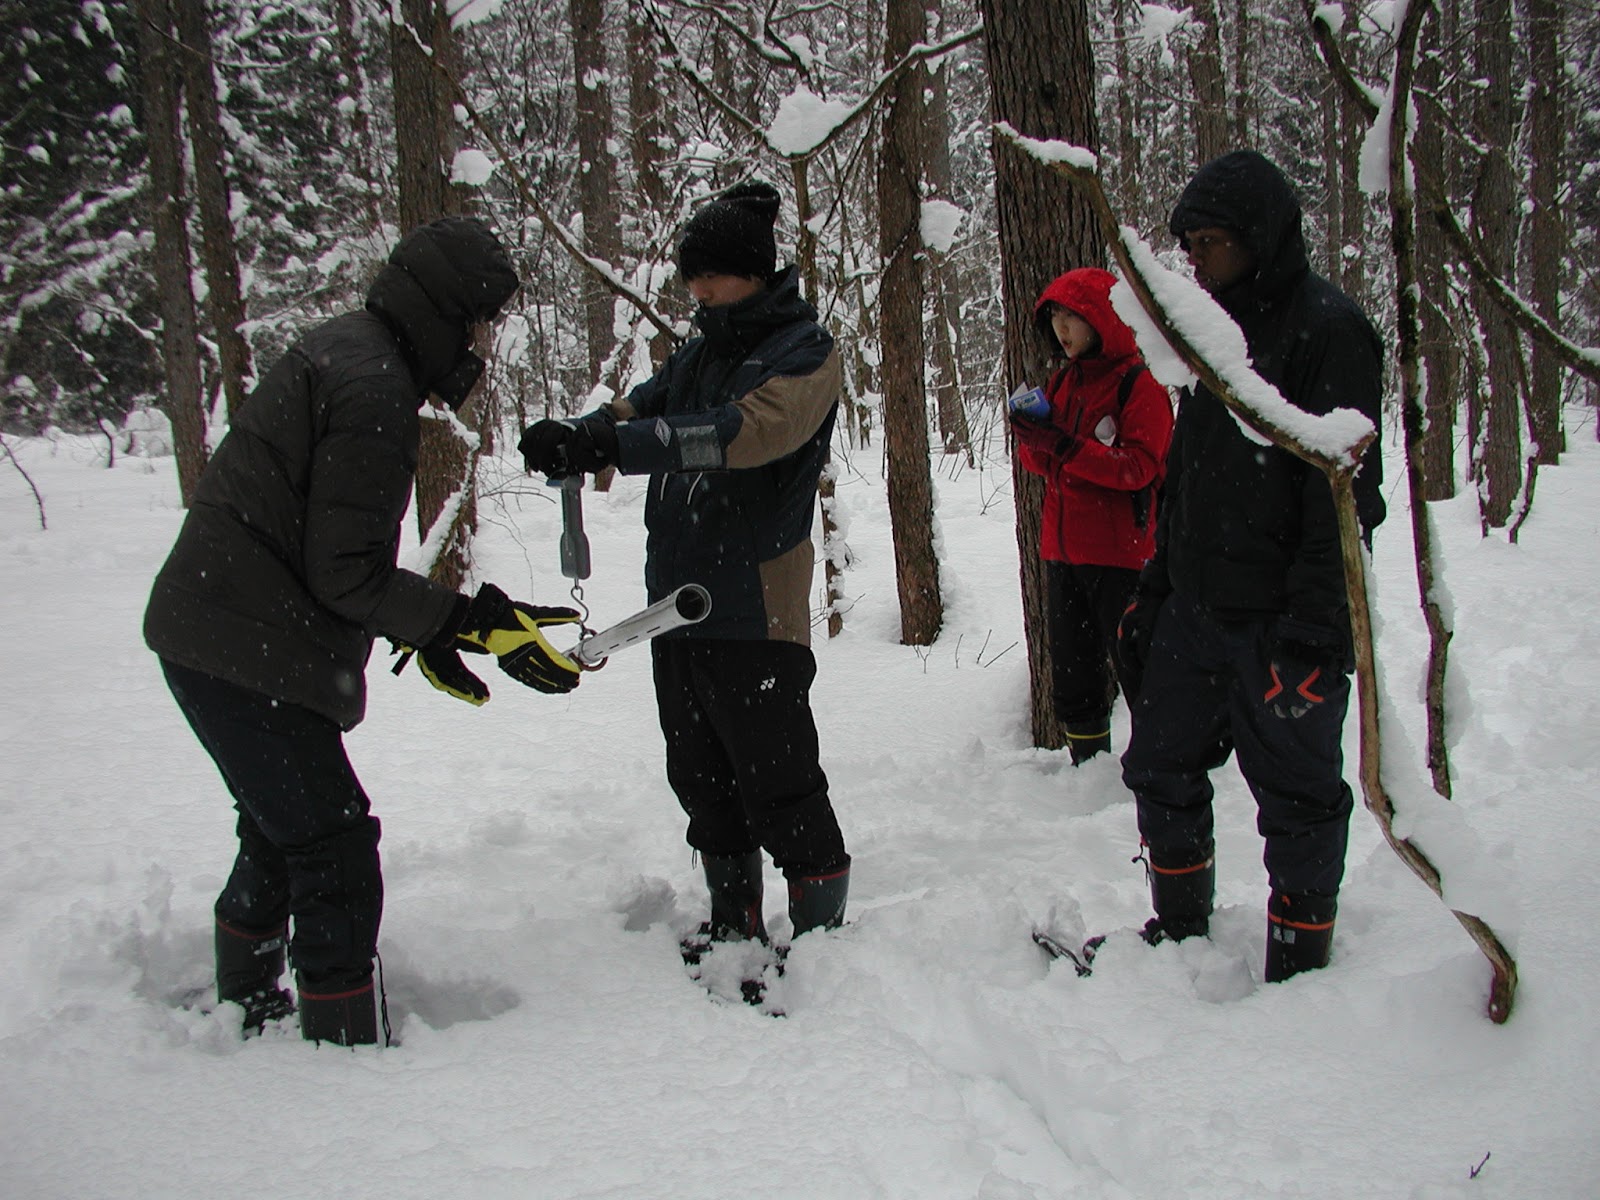
Snow survey results showed that the snow water equivalent (SWE) was less than in February, with about 51 cm SWE in the larch stand and about 35 cm SWE in the cedar stand (see photo above).

The snowmelt season has already begun with two runoff events early March, and the winter season also shows several significant runoff events during January and February (see hydrograph below).


The photo above shows a small log jam below the gauging station that was likely having an impact on the gauged water level and the stage-rating curve. The log jam was removed two days later on March 8th, when water levels immediately dropped by about 55 mm at the gauging station.

Thursday, 22 February 2018

February snow survey


Perfect mid-winter conditions today for our February snow survey. Recent fresh snow accumulation made for pleasant snow conditions, and calm and sunny weather to enjoy snow survey with several members new to the activity.

Snow water equivalent summary
Larch: 55 cm
Mature cedar: 39 cm


Wednesday, 31 January 2018

January snow survey


Today four members joined me for their first experience of snowshoeing and snow survey. Conditions were tough with heavy wet snow falling throughout the day, after a two week period of relatively heavy snowfall. We took 20 measurements in the larch stand to give the following mean values. Compared with recent years, the snowpack is relatively large.

Snow survey (Larch stand)
Depth: 112 cm
Density: 0.275
Snow water equivalent: 30.8 cm


Tuesday, 14 November 2017

Autumn rains bring higher baseflows


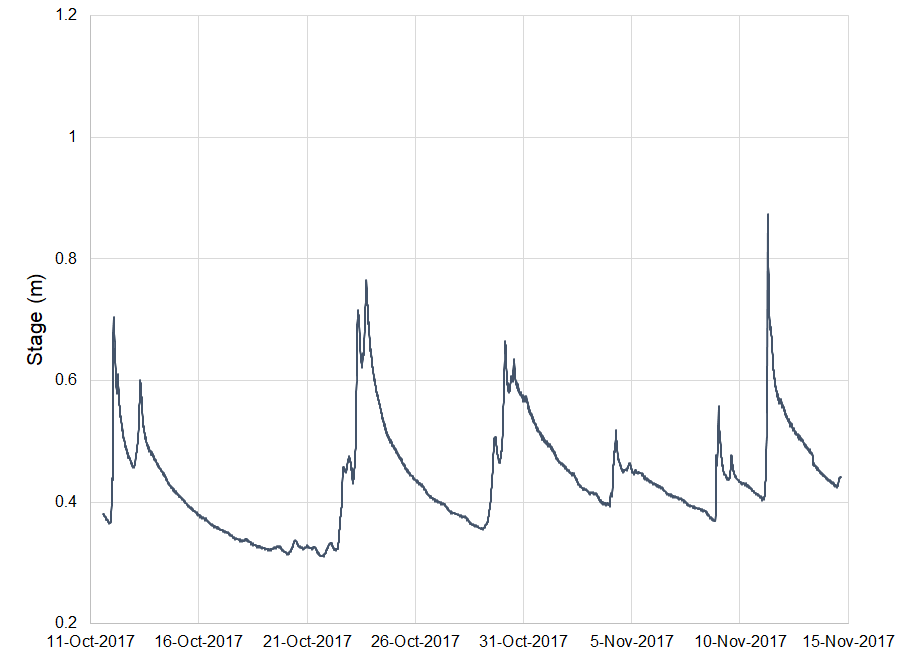
The hydrograph above shows the typical situation in autumn season when more frequent rainfalls and decreasing evapotranspiration leads to rising levels of baseflow. The interval between the rainfall events is becoming shorter, and note how the baseflow in between events is steadily rising. The baseflow level will remain high into December, only decreasing once the temperatures drop sufficiently for precipitation to change from rainfall to snowfall.