Wednesday, 27 June 2012

Waiting for the rain


The above hydrograph shows a small runoff event on June 20, when about 20-30mm of rain fell over the catchment (maximum intensity 8mm/h at both Miomote and Takane Amedas stations). The big rains of the season are yet to arrive. Sometimes they come right at the end of June, or during the first two weeks of July.

27 June, stage = 47.5cm (exactly the same as on 13 June)

Amedas precipitation gauge at Miomote. This gauge has a heated jacket system to measure both winter snow and rain. It is also set high at 3.5m above ground level to be clear of the winter snowpack.

Miomote River just below Miomote Dam

Wednesday, 13 June 2012

Early summer low flows


The hydrograph above shows falling low flows. The last diurnal snowmelt pattern is just visible initially, but this disappears as the snowpack finally melts away. We enter a period of dry sunny weather when river levels become low before the arrival of the rainy season storms.

13 June, stage = 47.5cm, snowmelt season is over

Wednesday, 30 May 2012

Snowmelt tails away


The hydrograph above shows one rain-on-snow peak on 16 May, followed by mostly dry fine weather when you can clearly see the daily snowmelt pattern. You will also see that the water level is on a downward trend through the second half of May, with the daily melt wave-pattern becoming smaller and smaller. This tells us that the snowpack is disappearing quickly.

30 May, stage = 54cm, snowmelt season nearly over

Friday, 11 May 2012

Peak snowmelt

11 May, stage = 71cm. Is peak snowmelt over?


End of April to early May usually brings the peak snowmelt. This year is no exception. See the clear sine-wave pattern in the hydrograph that reflects the same pattern in daily air temperatures which are driving the snowmelt. April 28 to May 2 is a period of fine dry weather with only snowmelt driving the streamflow, but the next three days are influenced by rainfall which causes the largest peak on May 5, a typical rain-on-snow flood event.

Snow has now melted off from the lower elevations, and so the fine weather snowmelt pattern is likely to slowly fade out over the next couple of weeks as the snowline retreats up into the mountains.

Friday, 20 April 2012

Melting snows


Streamflows increase steadily from March through April

Larch site snow lysimeter

Mature cedar site snow lysimeter

Young cedar site snow lysimeter

Tracks in the snow (Kamoshika deer)


After a one-month break from visiting Takiya River, there had been a major change in the seasons from late winter to full swing snowmelt season. Study the hydrograph above and see how the streamflows have increased steadily from the start of March. There are several peaks which generally occur with rain-on-snow, but notice how the low-flow level between the peaks is rising through March and April. This is the season when discharge is consistently high due to the melting snows. April normally has the largest monthly discharge value for the year.

Thursday, 22 March 2012

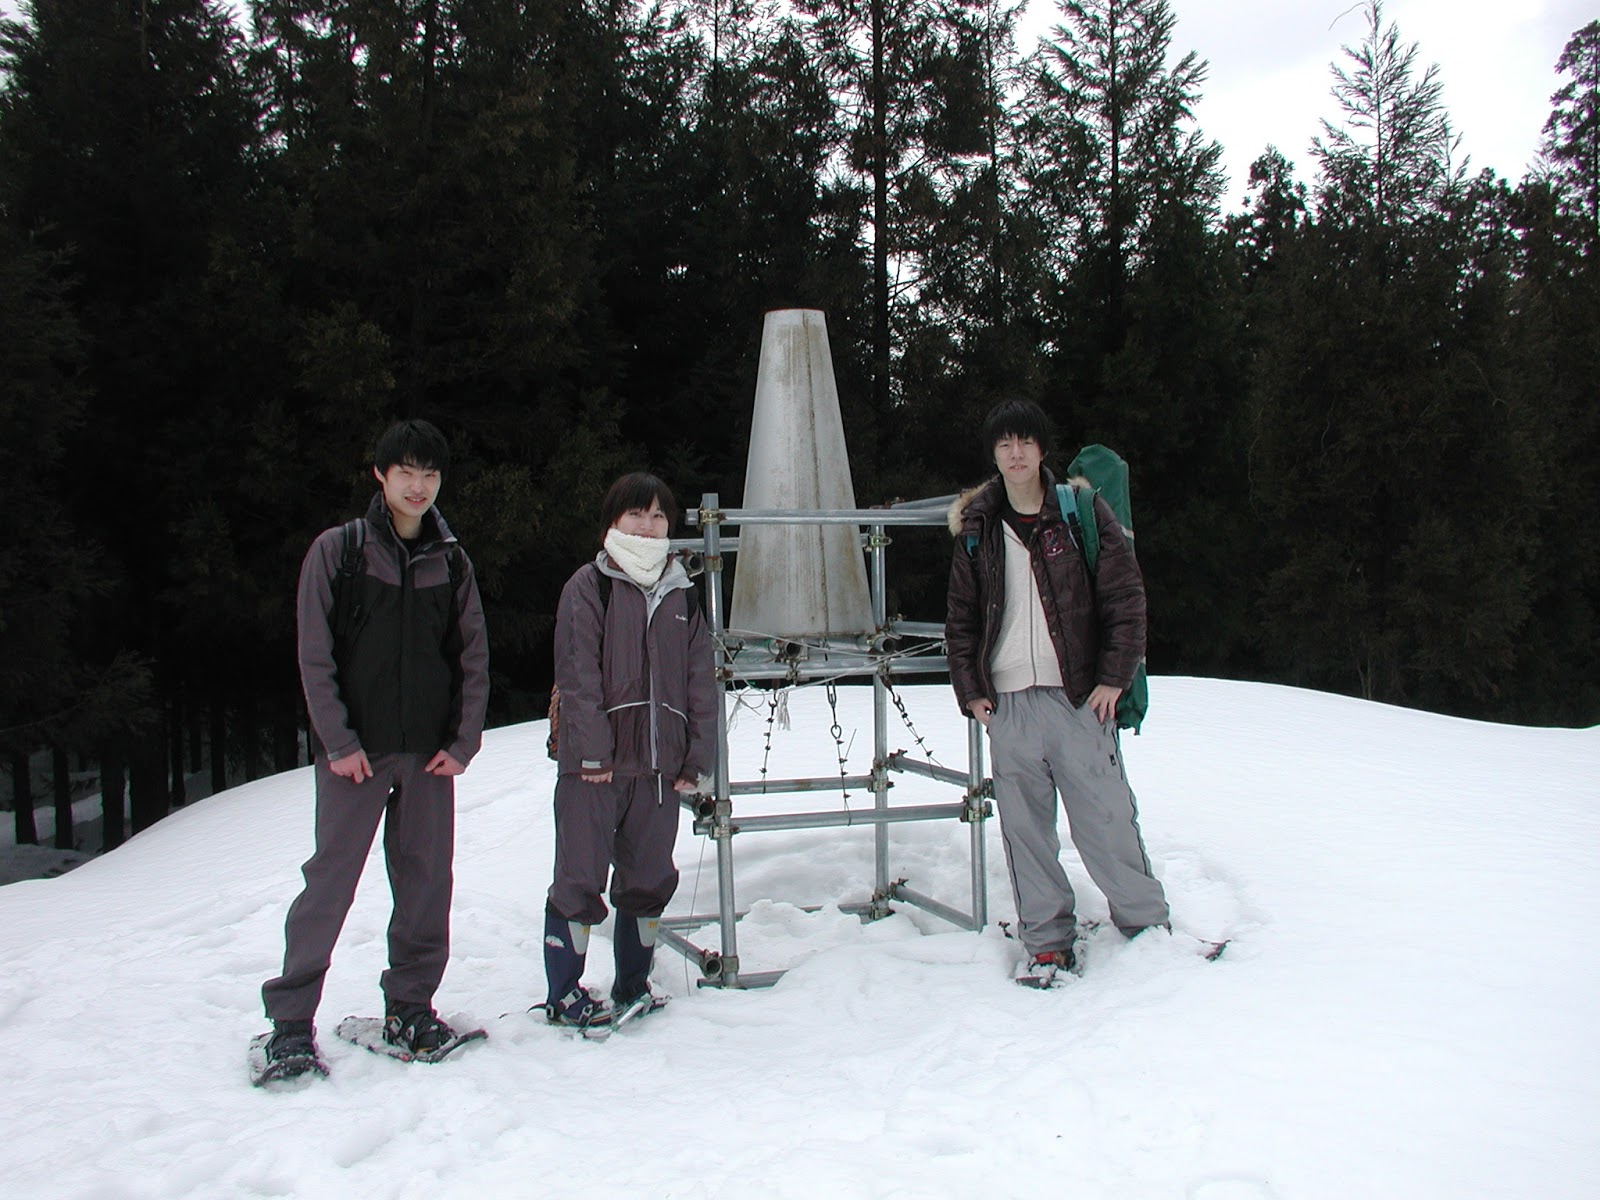
Mountain snow survey

View upvalley from summit (610m) after 2 hours of climbing

The high elevation beech forest (snow depth 250cm, SWE 100cm)

Takiya River stage = 55cm

Wednesday, 7 March 2012

Rain-on-snow

Warm temperatures and rain over the past few days swelled the river

Today's team at the tributary precipitation guage