Wednesday, 30 May 2012

Snowmelt tails away


The hydrograph above shows one rain-on-snow peak on 16 May, followed by mostly dry fine weather when you can clearly see the daily snowmelt pattern. You will also see that the water level is on a downward trend through the second half of May, with the daily melt wave-pattern becoming smaller and smaller. This tells us that the snowpack is disappearing quickly.

30 May, stage = 54cm, snowmelt season nearly over

Friday, 11 May 2012

Peak snowmelt

11 May, stage = 71cm. Is peak snowmelt over?


End of April to early May usually brings the peak snowmelt. This year is no exception. See the clear sine-wave pattern in the hydrograph that reflects the same pattern in daily air temperatures which are driving the snowmelt. April 28 to May 2 is a period of fine dry weather with only snowmelt driving the streamflow, but the next three days are influenced by rainfall which causes the largest peak on May 5, a typical rain-on-snow flood event.

Snow has now melted off from the lower elevations, and so the fine weather snowmelt pattern is likely to slowly fade out over the next couple of weeks as the snowline retreats up into the mountains.

Friday, 20 April 2012

Melting snows


Streamflows increase steadily from March through April

Larch site snow lysimeter

Mature cedar site snow lysimeter

Young cedar site snow lysimeter

Tracks in the snow (Kamoshika deer)


After a one-month break from visiting Takiya River, there had been a major change in the seasons from late winter to full swing snowmelt season. Study the hydrograph above and see how the streamflows have increased steadily from the start of March. There are several peaks which generally occur with rain-on-snow, but notice how the low-flow level between the peaks is rising through March and April. This is the season when discharge is consistently high due to the melting snows. April normally has the largest monthly discharge value for the year.

Thursday, 22 March 2012

Mountain snow survey

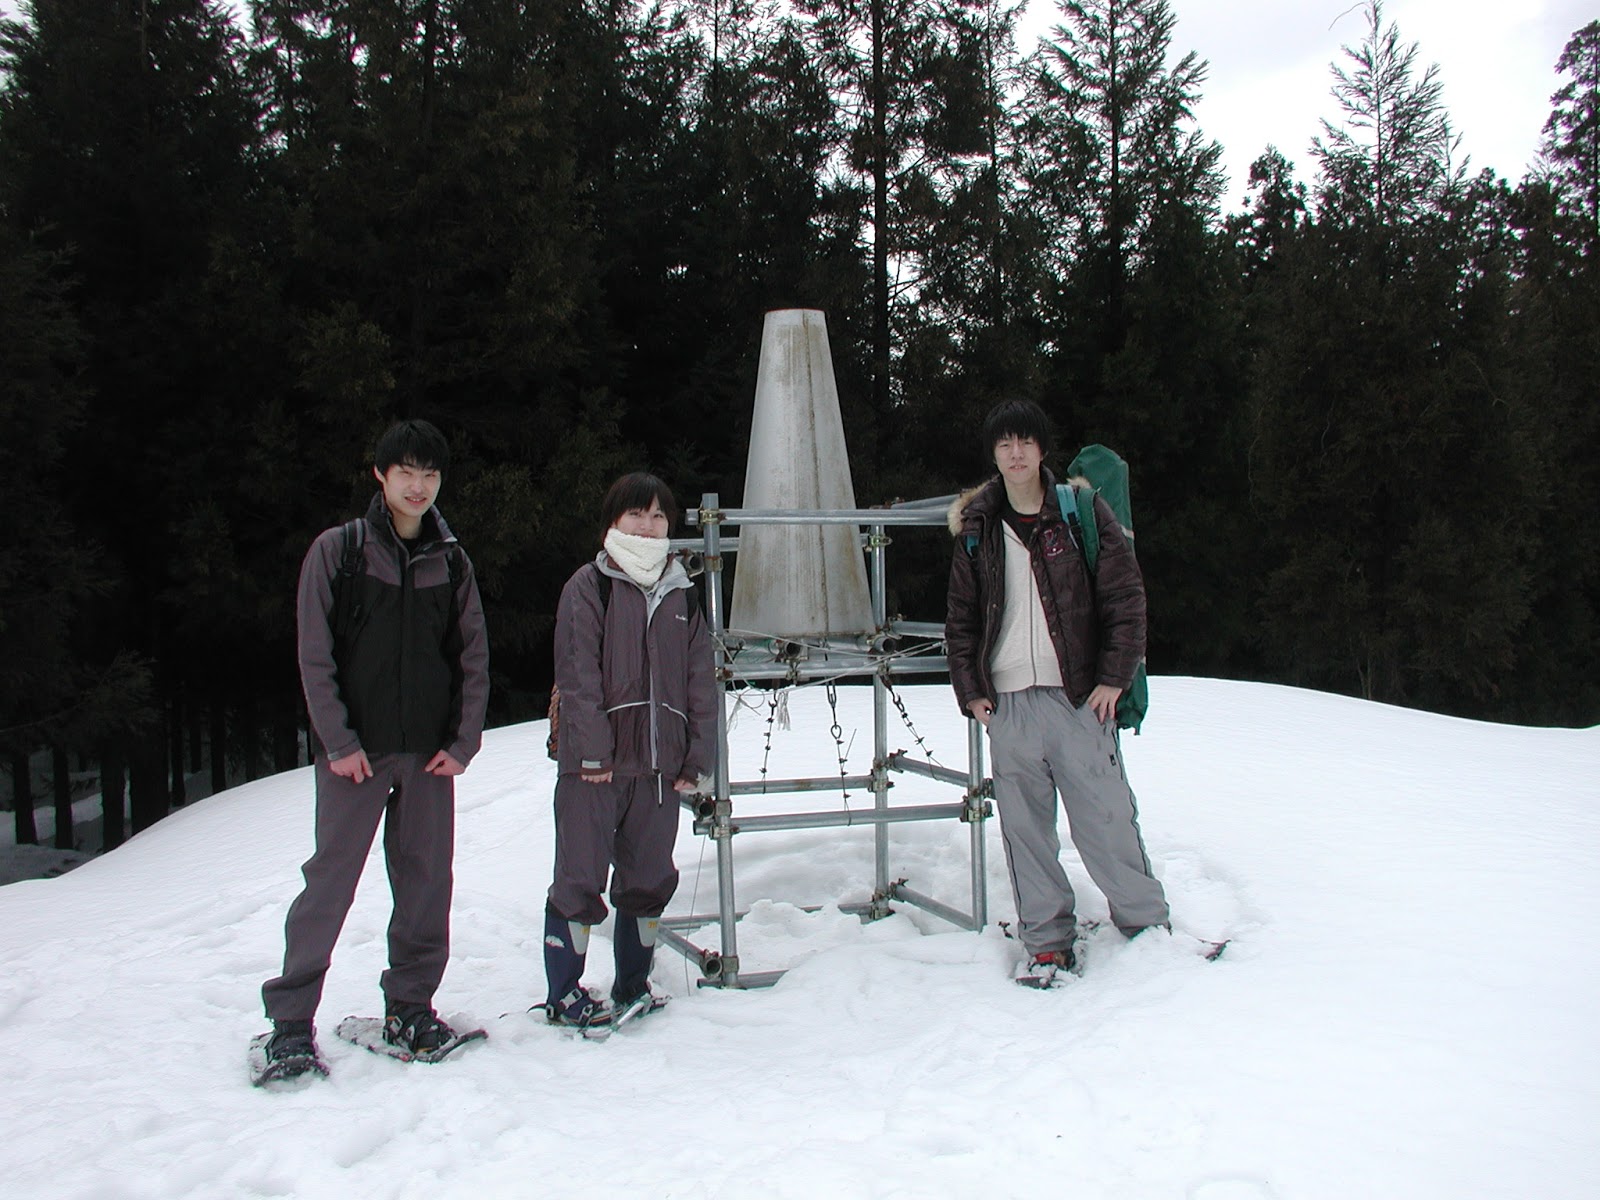
View upvalley from summit (610m) after 2 hours of climbing

The high elevation beech forest (snow depth 250cm, SWE 100cm)

Takiya River stage = 55cm

Wednesday, 7 March 2012

Rain-on-snow

Warm temperatures and rain over the past few days swelled the river

Today's team at the tributary precipitation guage

Monday, 13 February 2012

Deep Niigata snows

Typical mid-winter scene at the gauging station (low flow)

Fetching water for our lunch time coffee brew

Climbing up to the tributary site

Tributary site snow survey

Larch lysimeter site

Tributary cedar lysimeter site

Valley bottom cedar lysimeter site

Local village of Nunobe

Wednesday, 25 January 2012

Snow lysimeter troubles

Cover removed from lysimeter bucket to allow cleaning

Another day of sub-zero field work and snow survey difficulties, but we did at least have blue skies and sunshine! First up I had to dig out the lysimeter bucket at the larch site as looking at the logger data it had not moved at all. This is a sure sign of trouble as even during the coldest periods the bucket will tip several times a day due to ground heat melt at the base of the snowpack. I found the trouble - larch needles clogging the bucket intake - and cleaned it all up nicely. Mind you, I had to remove about 70cm of snowpack and get down on my knees to reach it, as it is set well below ground level.

Compared to two weeks ago, barely any new snow had accumulated. This is most rare for January, which along with December generally has the heaviest and most frequent snowfall. The weather can change dramatically over short distances in Japan. While we basked in sunshine all day in Murakami (albeit -3 degrees), the area from Niigata City to the south was getting hit by the biggest snow storm so far this year.