The provisional estimate for April runoff is just 240 mm, which is a record low by a large margin.
April runoff is very important as in almost every year April runoff is the greatest of any month, and it coincides with the planting of the rice paddies at the end of April to early May when demand for agricultural water resources is high.
Year April runoff (mm) Comment
2020 240 Lowest on record (since 2001)
2019 348 2nd lowest on record
2018 617 4th highest on record
Note: Average April runoff (2001-2019) is 500 mm.
The table above shows April runoff for the last three years. The two lowest April runoff values have occurred in the last two years, and this year's record low is a full 108 mm lower than the previous record low, and less than half the average value of 500 mm.
Lack of seasonal snowpack is the main reason for these low April flows. April precipitation was actually a little above average at both Miomote and Takane (168mm/198mm compared to averages of 149mm/171mm respectively) and so cannot explain these low flows.
Friday, 8 May 2020

Thursday, 7 May 2020
Diurnal snowmelt pattern absent
 |
| Stage 0.404m, discharge 0.801m3/s within 2% of the rating curve estimate |
With the coronavirus pandemic the university has severely restricted student research activity and fieldwork. Today I visited the field with family support to allow us to continue to check up on the monitoring and collect a new discharge measurement. We confirmed there has been no change in the rating curve.

The hydrograph above shows little if any diurnal snowmelt pattern, due to the extremely low snowpack conditions this winter and spring. Two significant rainstorms produced modest runoff peaks which would have been much larger with additional snowmelt contributions had there been snowpack.
Date Event precip. (mm) Max intensity (mm/h)
1-2 April 40.5 5
18-19 April 52.5 6
Overall, runoff for the month of April appears much less than average (provisional data under preparation).
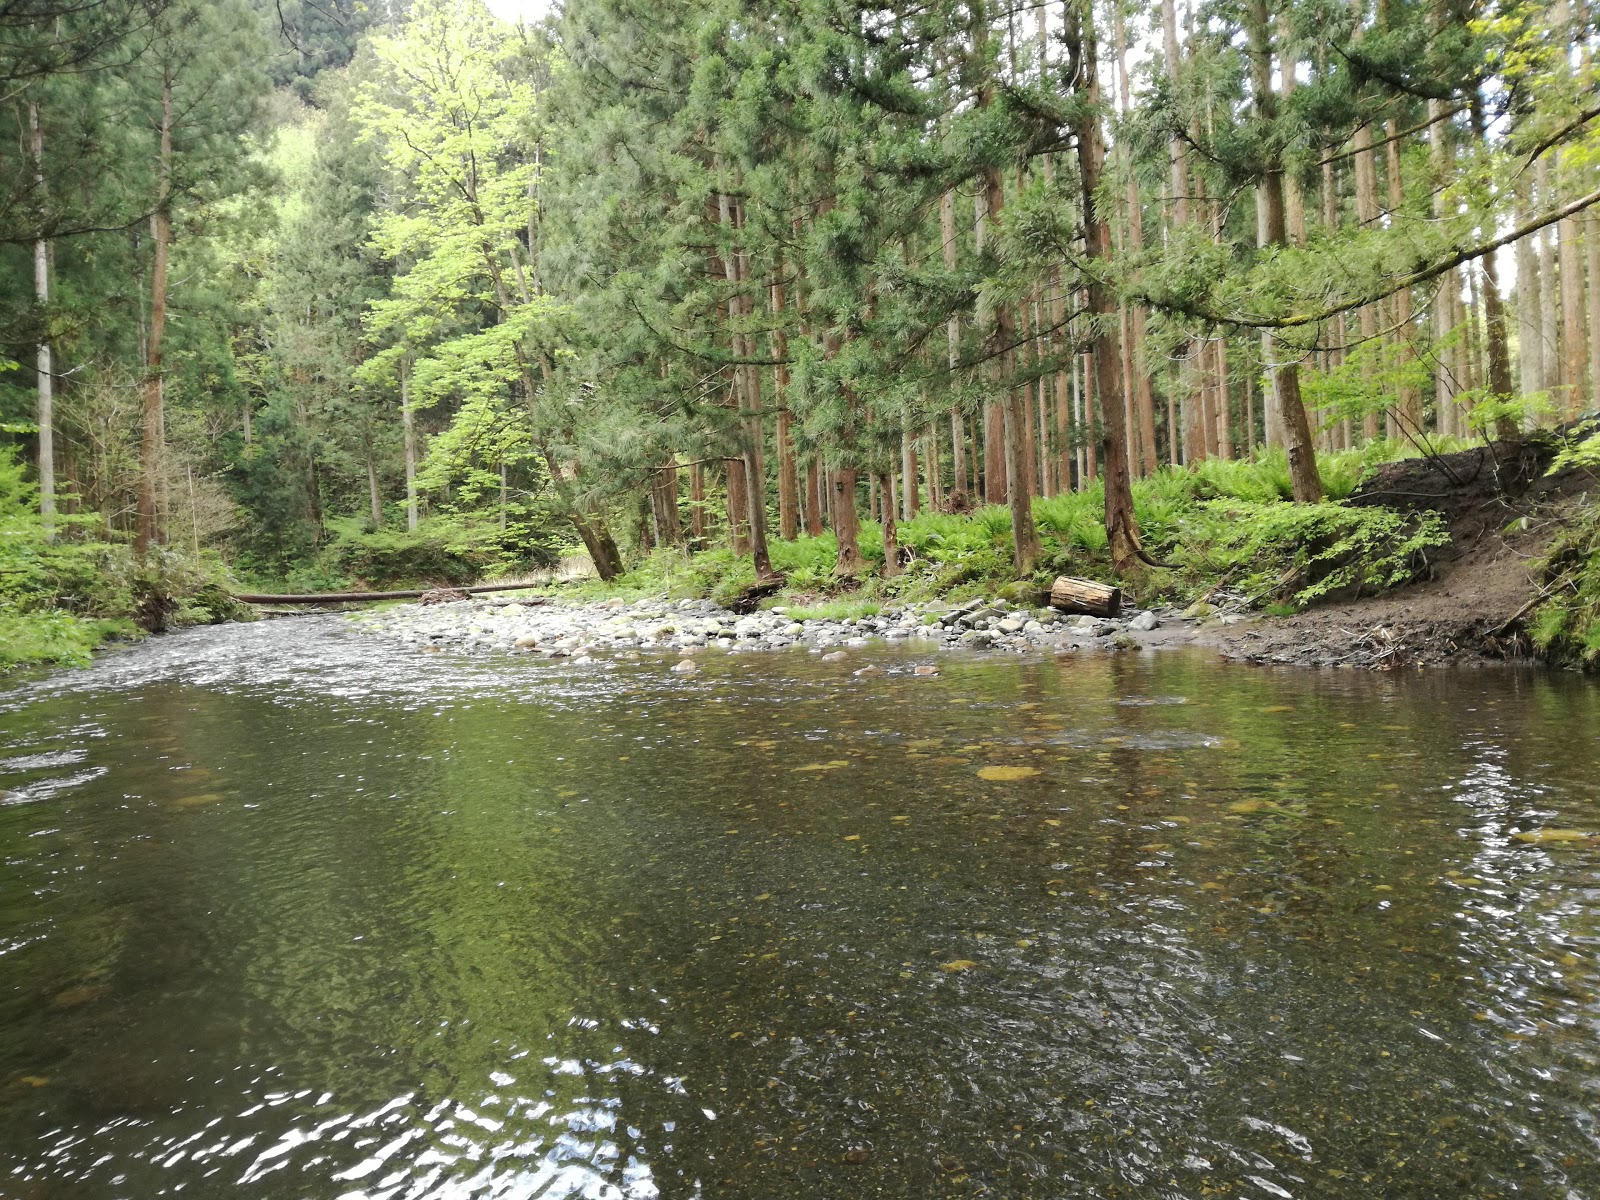 |
| Takiya below gauging point - right bank disturbed by recent logging activity |
 |
| North of the Takiya basin, the Asahi Mountains (1870m) still snow-covered as viewed from Washigasu Maenodake (825m) |
Tuesday, 31 March 2020
Winter stage data download
 |
| 31 Mar: Runoff is 7.02 mm/day |
Today I downloaded both the stage loggers (Kadec, Hobo) to evaluate the winter season runoff. The hydrograph below shows that there are multiple peaks due to the high frequency of rainfall and the absence of any significant snowfall in the basin this winter. Winter rain-on-snow is not unusual for this basin, however, the hydrograph below shows particularly high rainfall activity for winter due to the record warm temperatures. Even over the basin elevation range of 40-950 m, the dominant precipitation phase was rainfall.

Notable runoff events include:
Date 2-day precip. Max. intensity
8-9 January 74 mm 9.5 mm/h
16-17 February 50 mm 5 mm/h
10-11 March 39 mm 7 mm/h
27-28 March 41 mm 7 mm/h
The 52 mm of precipitation on 8 January tied with the record for the highest daily precipitation measured in January. The 9.5 mm/h maximum precipitation intensity was the second highest for January (since 1982).
Monday, 17 February 2020
No seasonal snowpack this year
Niigata City and indeed much of Japan just had the warmest January since records began in 1882. The average January temperature during 1981-2010 was 2.4 degrees Celsius, while this year it was 5.2 degrees Celsius. The second warmest January on record was in 2007 with 4.9 degrees Celsius. Globally, January 2020 was also the warmest on record.
Some snowfall occurred in early February, but most of that has already melted away at the low elevations. In 20 years of snow survey at Takiya River basin, this is the first time that there has not been a seasonal snowpack at low or even medium elevations (0-600m).
Strong warm winds and rainfall (8 m/s, 11.7 degrees Celsius, 51 mm) combined to produce rain-on-snow conditions and high runoff with some suspended sediment load. Even high elevations above 500m only retain patchy snow cover.
 |
| Location of snow lysimeter in larch stand near gauging station |
Some snowfall occurred in early February, but most of that has already melted away at the low elevations. In 20 years of snow survey at Takiya River basin, this is the first time that there has not been a seasonal snowpack at low or even medium elevations (0-600m).
 |
| Stage about 0.8m at the gauging station |
Strong warm winds and rainfall (8 m/s, 11.7 degrees Celsius, 51 mm) combined to produce rain-on-snow conditions and high runoff with some suspended sediment load. Even high elevations above 500m only retain patchy snow cover.
 |
| Forest harvesting activity near the gauging station (Japanese cedar, "Sugi") |
 |
| Small mountain shrine about 2 km upstream of the gauging station |
Tuesday, 17 December 2019
Warm December
 |
| 17 Dec: Runoff is 6.34 mm/day |
One of the warmest and driest Decembers ever recorded at Murakami, close to the field site. No sign of seasonal snow cover yet, and unusually for December, we even managed to measure the discharge.

Wednesday, 27 November 2019
New water year brings autumn rains
 |
| 27 Nov: Runoff is 6.45 mm/day |
In the hydrograph below you can clearly see the low flow at the end of September is followed by a major runoff event in early October which raises the baseflow for the rest of the month and into November. This is typical for increasing precipitation and falling ET to lead to higher baseflows into autumn. October monthly runoff (151 mm) is more than three times larger than that for September (46 mm).

Monday, 30 September 2019
September low flows
 |
| Very low flow conditions, equivalent to 1.17 mm/day (30 Sep) |
 |
| Sand and woody debris deposited around the staff gauge |
The month of September experienced exceptionally dry conditions this year, as shown by the stage hydrograph below. Only two minor precipitation events can be seen, and long periods of baseflow recession. The monthly runoff was one of the lowest on record for Takiya River, at just 46 mm. The lowest recorded monthly runoff during the period of record (2000-2019) was August 2012 with 35 mm.

Comparing the Kadec and Hobo stage data, it seems the newer Hobo logger is giving more stable data readings. Instability in the Kadec data during low flows could be due to effects of water temperature fluctuations not being compensated for adequately.
Subscribe to:
Posts (Atom)