Wednesday, 8 May 2019
April 25 rain-on-snow
A period of fine weather melt with building diurnal snowmelt peaks turned to rain on April 25 to give the sharp rain-on-snow peak in the hydrograph above. Daily precipitation was a moderate 27 mm (Miomote Amedas), but peak intensity reached 5.5 mm/h. Fine weather melt pattern returns and is especially clear during 3-6 May with near-symmetrical sine waves.
The images below are taken from a time-lapse camera, showing the gauging site conditions (upstream view) during the rain-on-snow event from 24 April through to the peak stage of 0.894 m at 13:40 on 25 April. The colour of the water indicates the suspended sediment load, which increases rapidly as rainfall intensity increases after 0840 on 25 April.
The image below shows today's river condition (8 May). Fine weather melt continues and stage is 0.505 m. The gauging cross-section shows evidence of fine gravel accumulation which has caused a deviation from the established stage-rating curve.
Wednesday, 24 April 2019
Snowmelt runoff pattern emerges
The hydrograph above shows that the typical snowmelt pattern - daily fluctuations like a sine wave - become clear from about 14 April. This is because of rising temperatures and continuing fine weather.
Discharge measurement was undertaken with stage rising from 0.615m to 0.645m as daytime melt started to kick in around noon. We also collected data from a temperature sensor set in a cedar tree at 200m elevation. This will be compared to temperatures measured at the local climatological station near sea-level (Murakami Amedas).
Wednesday, 10 April 2019
Snowmelt on hold
A cold April so far, with fresh snowfall events even down at sea-level elevations. Today was only about 5 degrees Celsius, and turning to rain in the afternoon or snow in the mountains. The stage hydrograph barely shows the diurnal snowmelt pattern which is typical during fine weather in this season. Snowpack remains in some shady spots near the gauging station (see photo above), while the cedar lysimeter had melted off (see photo below).
Tuesday, 26 March 2019
Winter runoff data download
First time to download the water level data loggers after the long winter season. Here I am plotting the data from the Kadec logger, which shows there were three notable rain-on-snow (ROS) peaks (2 Feb, 20 Feb, and 12 Mar) all with a peak stage of about 0.8m. Low winter baseflow continued for about one month from late December to the first ROS event on 2 February. After the second ROS event on 20 February the base flow remains higher as we enter the snowmelt season.
Marginal snowpack remains in the forest around the stream gauge. The snow lysimeter at the larch site was relatively more exposed than at the cedar site. It is normal for the larch site to melt-off a few days before the cedar site. Melt-off dates seem likely to be close to average (end March to early April). The lack of ponding in the larch lysimeter trays indicates good drainage conditions with no problems.
Thursday, 7 March 2019
Snowmelt season in full swing already
 |
| Mountain site (elevation 200m) |
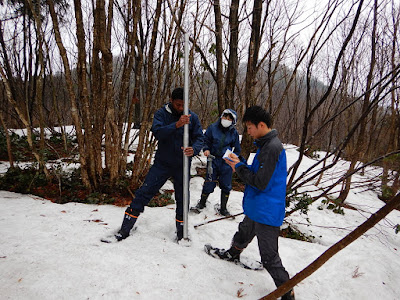
Snowmelt season has arrived very early this year, and there has been significant melt since the last snow survey on February 13th. The relative snow density is already up to around 0.42, compared to about 0.30 on February 13th. Surprisingly, melt has progressed much more rapidly at the higher elevation mountain site (200m) compared to the valley site (60m). Possible reasons are frequent temperature inversions during early spring season, and greater exposure to solar radiation and warm winds at the mountain site. Both sites have deciduous forest cover.
Snow survey summary
(depth / density / SWE)
Valley (60m) Mountain (200m)
Feb 13 111cm / 0.30 / 33.6cm 120cm / 0.28 / 33.3cm
Mar 7 60cm / 0.42 / 25.2cm 48cm / 0.42 / 20.1cm
 |
| Mountain site |
 |
| Valley site (elevation 60m) |
 |
| Snow lysimeter at valley larch site |
 |
| Tracks of "kamoshika" deer (like a mountain goat) |
 |
| Takiya River |
Wednesday, 13 February 2019
Snow accumulation progressing
Snow depth at the larch site (see above) had almost doubled since the last survey in mid-January. Depth now 111cm, density unchanged at 0.3, and snow water equivalent 33.6cm.
Snow survey at a nearby mountain location (elevation 200m, see below) revealed almost identical SWE, although the density was slightly lower and snow depth correspondingly higher.
Friday, 18 January 2019
Snow survey and lysimeter check
Snow survey at the larch site revealed average depth 66cm, average density 0.31, and snow water equivalent of 20.3cm at this low elevation location near the stream gauge.
Lysimeter drains were dug out to remove debris from the drain plug and ensure free drainage before replacing the snow cover.
Subscribe to:
Posts (Atom)


