Wednesday, 28 November 2018
New local logging activity
The above hydrograph shows that there are frequent rainfall events during November, with two significant peaks of about 0.6m to 0.7m stage (maximum daily rainfall of 37.5mm on 21 Nov.).
Below you can see that some local logging activity has begun close to the gauging station. The impact on the ground and soil of the caterpillar tracked felling machine appears to be rather severe, and does not compare well to the traditional aerial yarding technique which I witnessed being practised here about 20 years ago.
Friday, 2 November 2018
Autumn rains kick in
Big change in the situation of the basin since late October. Over the period of a week the river stage rose from about 0.3m (low flow) to 0.8m (moderate high flow) due to continuing and unusually heavy rainfall (190mm total with maximum intensity of 16.5mm/h).
Tuesday, 16 October 2018
October - new water year
First field trip since the start of the new water year on 1st October. The 1st October begins with low flow conditions, but the first autumn rainfall event of the new water year arrives with a small peak flow.
Stage data was downloaded for both sensor systems - the Kadec/Druck and Hobo systems. The photos below show the Hobo logger attached to the same support pipe as the staff gauge, within a grey PVC casing.
Friday, 28 September 2018
September wetter than usual
Early September began wetter than usual and another powerful typhoon (#24) is due to arrive around 30th September. Today's discharge measurement was 0.975 m3/s at 0.425 m stage, which fit exactly on the current rating curve.
Wednesday, 5 September 2018
Persistent rains during late August
As you can see from the hydrograph above, the drought finally broke on 16th August with a good sized flood, followed by unusually persistent rains (similar to rainy season) during the last week of August. This season normally has flash-floods with short-lived peak discharges. This kind of persistent rain will have done much to replenish the groundwater levels which were at extremely low levels through June and July.
The updated stage-rating curve below shows that recently measured high flows seem to plot well below the previous curves, while medium to low flows are similar. As always, further measurements are needed to confirm this apparent change in the shape of the stage-rating curve.
Thursday, 2 August 2018
Drought conditions and low flows
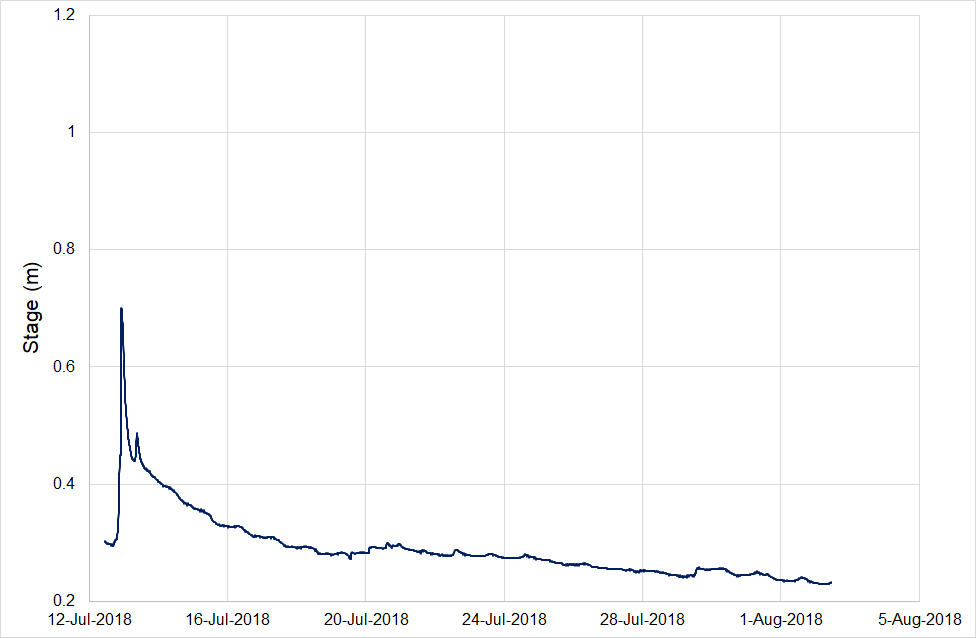
Except for short-lived rainfall events end of June and mid-July, the drought conditions have continued throughout most of June and July. These two months usually bring the rainy season and 443 mm of precipitation (1981-2010 mean), but this year only 181 mm was recorded (see monthly data given below).
Miomote Monthly Precipitation (Amedas)
Month 2018 Mean (1981-2010)
1 319 266
2 231 190
3 128 160
4 231 149
5 319 150
6 96 180
7 85 263
8 477 209
Total 1886 1567
August became extremely wet for the second half of the month, recording nearly 500 mm over just 2 weeks or so. This unusual distribution of precipitation led to extreme low flow conditions and water shortages until the rains finally arrived on August 16 (see next blog post). Despite above average precipitation overall for the period January to August, the unusual distribution led to a three month droughty period from mid-May to mid-August.
Thursday, 12 July 2018
Rainy season false start
The end of June brought a false start to the rainy season. Going into July and continuing for two weeks and more there was almost no rain and conditions were unusually hot and sunny.
Subscribe to:
Posts (Atom)