Wednesday, 28 October 2015

Landslide influences upstream

Stage = 44cm, Ta and Tw = 12.5C


About once a year I make sure to walk the course of the river upstream of the gauging point to survey the general conditions of the river channel. In particular I'm looking for evidence of recent channel change and bank erosion, and any other potential sources of sediment. This helps us to understand changes in the channel such as aggradation and degradation at the gauging point, and also changes in the H-Q rating curve.

Today we walked about 2km upstream to a landslide zone where an unstable hillslope is feeding fine gravel bedload sediment and silt and clay suspended sediment to the channel. Although the channel is gravel and boulder bed in character, there are many locations where the channel is confined by bedrock. Overall the impression we get is of a very stable channel with very little evidence of bank erosion, until we arrive at the landslide zone. However, we can see many zones of fine gravel sediment storage to indicate the continuing influence of the landslide in the channel sediment budget.

Stable step-pool reach

Temporary storage of fine gravels from the landslide zone

This meander cut-off formed in 2005 (previously cedar forest)

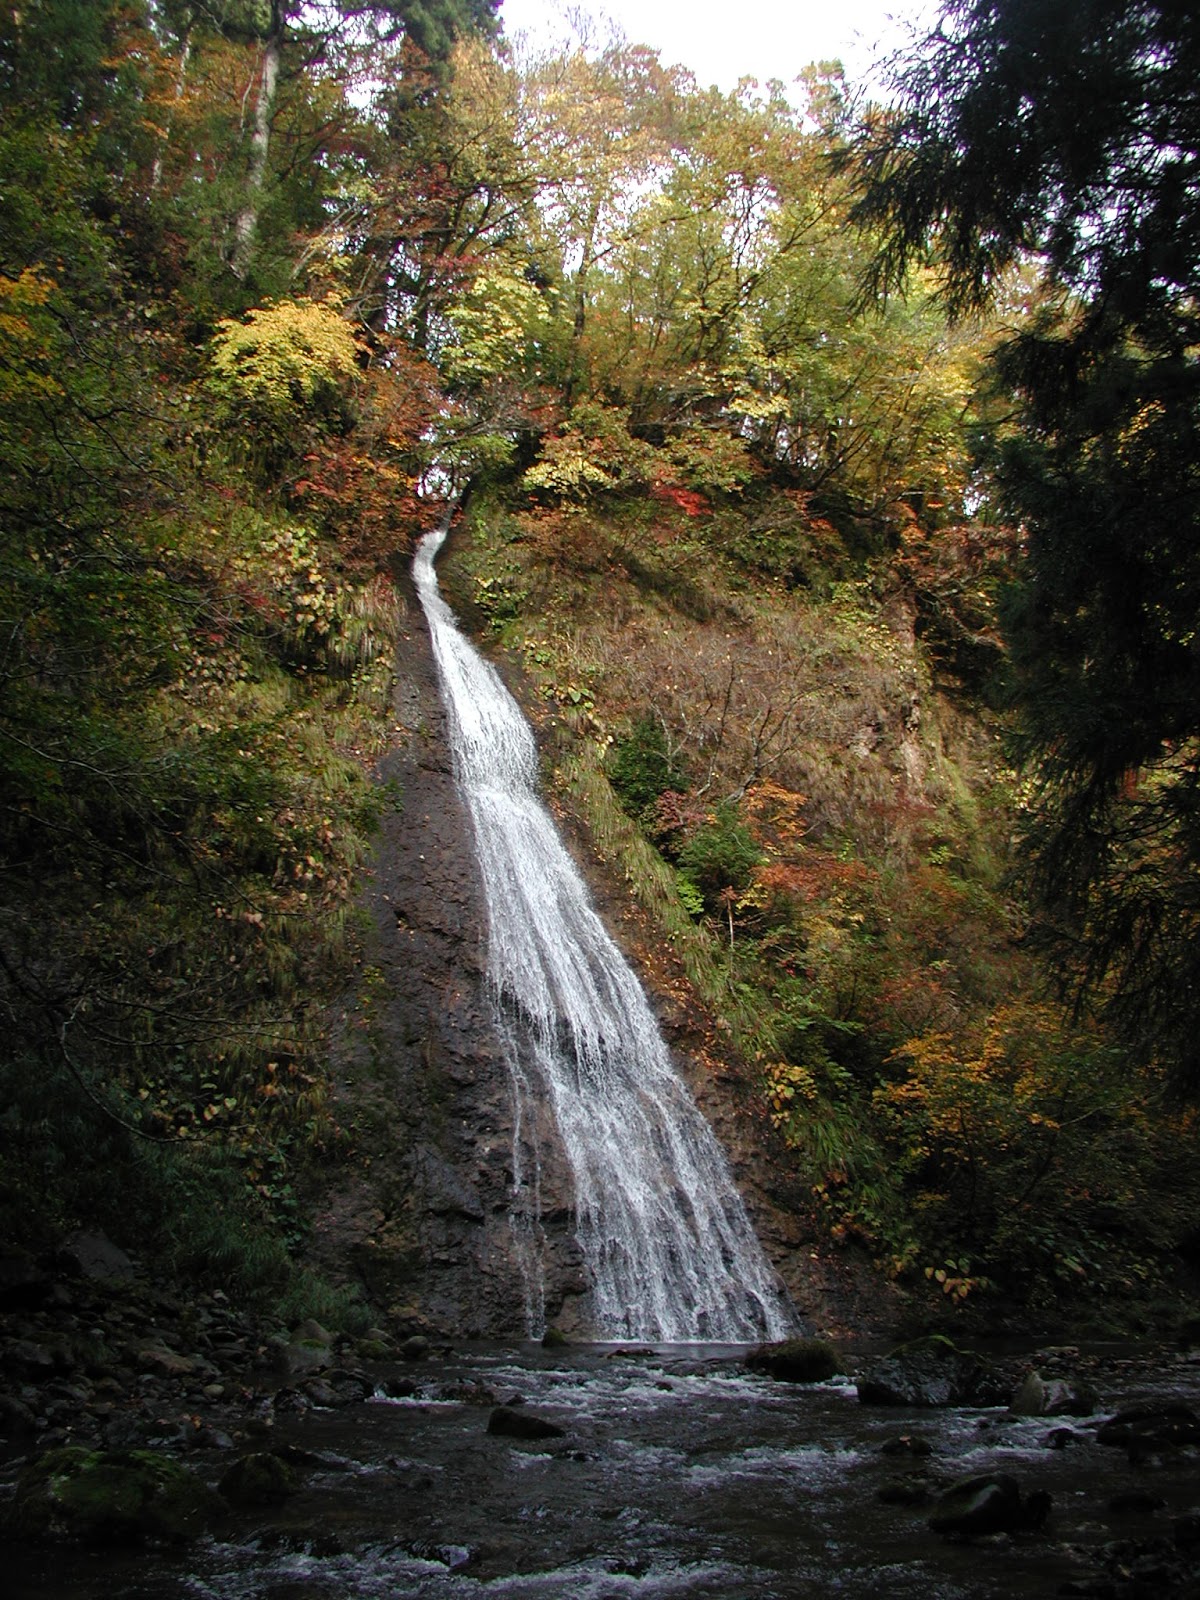
Tributaries often join the main channel via waterfalls

Stable boulders form step-pools

Groundwater seep at the landslide zone

Slope materials are fine angular gravels and also a grey silt/clay

Falling trees indicate active landslide zone

Wednesday, 7 October 2015

Typhoon season

Stage = 37.5cm, Ta = 13.4C, Tw = 12.6C
Generally the Niigata area (and the Japan Sea region) is not influenced as strongly by typhoons as the Pacific coastal region. Southwestern Japan is more severely affected by typhoons as they normally make landfall on the Pacific coast, but once in a while a typhoon will track up over the Japan Sea and make landfall in northern Japan.

This year fine autumn weather continues most days in the period shown in the hydrograph below, but the moderate peak on 2 October was due to a powerful storm - the remnants of a typhoon system moving up the Japan Sea. At the Takane Amedas gauge, over 50mm of rainfall occurred during 1-2 October with maximum intensity of 17.5mm/h.


Crystal clear water at the gauging cross-section

Staff gauge needs to be put straight one of these days

Wednesday, 16 September 2015

Wet September start


Unsettled weather during the first half of September has raised the soil and groundwater levels. The hydrograph below shows repeated peaks, building in size up to a small peak flow event on 11 September (55mm precipitation over 10-11 Sep.).


Today's fieldwork included taking a velocity profile in the centre of the channel (see figure below), where the flow depth was 24cm. We could confirm that the mean flow velocity in the vertical profile occurs at the depth of 0.6 x depth (measured from the surface). The USGS wading rod that we use makes this assumption in setting the representative depth at which to take a single velocity measurement in each vertical profile.


Tuesday, 1 September 2015

August 15 flash flood


August saw dry conditions return again for the first two weeks, before a sudden flash flood of moderate size on August 15, when river stage rose by about 50cm during just 10 minutes from 11:40 to 11:50, reaching a peak of 1.0m.

Analysis of the local Amedas precipitation at Takane and Miomote shows that the storm path was from north to south, or in other words, the storm path was moving in the downstream direction. This likely contributed to the extremely sudden rise in the stage hydrograph.

North of the basin (Takane) intense precipitation of 6~8mm/10 min. occurred during 9:20~10:00, while south of the basin (Miomote) intense precipitation of 6~12mm/10 min. occurred during 10:30~10:50. Maximum hourly precipitations were 36mm at Takane, and 24.5mm at Miomote.

The series of images below is taken from time-lapse photography at the gauging site. The first five images show the arrival of the intense precipitation, and the last three images show the sudden rise in the river stage.


Wednesday, 29 July 2015

Below average precipitation


Although the hydrograph above shows small to moderate peak flow events during July, the total precipitation for the month was well below average (170mm compared to 30-year average of 263mm). The full force of the rainy season never arrived in Niigata this year. Continuing dry conditions in the first half of the month allowed flows to decrease to similar levels as late June (pre-rainy season). Interestingly the ET induced diurnal fluctuations become less clear as the lowest flows are reached.

The peak flow on July 18 was due to 31mm daily precipitation at Miomote, while the multi-peak flow during July 23-24 was due to nearly 90mm total precipitation and a peak hourly rate of 19mm/h.

Wednesday, 8 July 2015

Low flows and peak flows


This year has seen below average precipitation during June (125mm compared to 180mm average). You can see in the hydrograph above that the period 17-26 June was completely dry, and we can even see small downward dips in the water level during day-time as evapotranspiration rises. This phenomena is only seen during mid-summer when river and ground water levels are relatively low and soil conditions are dry. A minimum stage of 0.261m is observed on 26 June.

During 27-28 June a rainstorm drops 66mm (max. 9mm/h) causing a moderate peak flow. However, soil and ground water storage is barely replenished, and flow levels quickly decrease to near 0.3m after a week or so.

Ta = 22C, Tw = 17C, Stage = 0.32m, Q = 0.357m3/s

Today we also carried out a survey of the channel long-profile, measuring by level the elevation of the channel thalweg and the water surface slope. Over the 90m reach shown in the photo above, the channel slope was 1.14%, while the channel slope over the 100m upstream of the gauge was 0.78%. The overall water surface slope for the 190m reach was 0.948%, with a drop in elevation of 1.801m.


Considering the reach between 50m upstream and 50m downstream of the gauging point, the slope was 0.84% compared to 0.90% surveyed in 2004. This suggests the slope at the gauging point has decreased slightly since 2004. We are currently undertaking an analysis of the hydraulic geometry and stage-rating curves for the gauging point, for which estimates of channel slope are essential. Measurements of channel slope during flood discharge will also be required.

Wednesday, 17 June 2015

Low-flow season


The snowmelt season has now finished for the Takiya basin, and we enter a period of low-flows as dry weather continues through the first 2-3 weeks of June. The hydrograph above shows an overall downward trend in water levels - the diurnal snowmelt pattern disappears at the end of May and after that several small rainfall events interrupt the decrease in flows.

Rainy season has already been in full swing in Kyushu and southern Japan, but it seems the rains will not arrive in Niigata yet. Until the rains come, we will see some of the lowest flows during a year. Annual minimum flows usually occur before the rainy season arrives in late June, or at the end of summer in late September.

Torrential localized rainfall has been a feature of the weather in Japan over the past week as unstable atmospheric conditions prevail. Today the precipitation station north of Takiya basin (Takane) recorded 54mm/h during a storm, while the Miomote station to the south recorded zero rainfall.

Stage = 31.5cm, Q = 0.32m3/s, Ta = 24C, Tw = 17C

Miomote gauge (JMA Amedas network)