Wednesday, 8 July 2015

Low flows and peak flows


This year has seen below average precipitation during June (125mm compared to 180mm average). You can see in the hydrograph above that the period 17-26 June was completely dry, and we can even see small downward dips in the water level during day-time as evapotranspiration rises. This phenomena is only seen during mid-summer when river and ground water levels are relatively low and soil conditions are dry. A minimum stage of 0.261m is observed on 26 June.

During 27-28 June a rainstorm drops 66mm (max. 9mm/h) causing a moderate peak flow. However, soil and ground water storage is barely replenished, and flow levels quickly decrease to near 0.3m after a week or so.

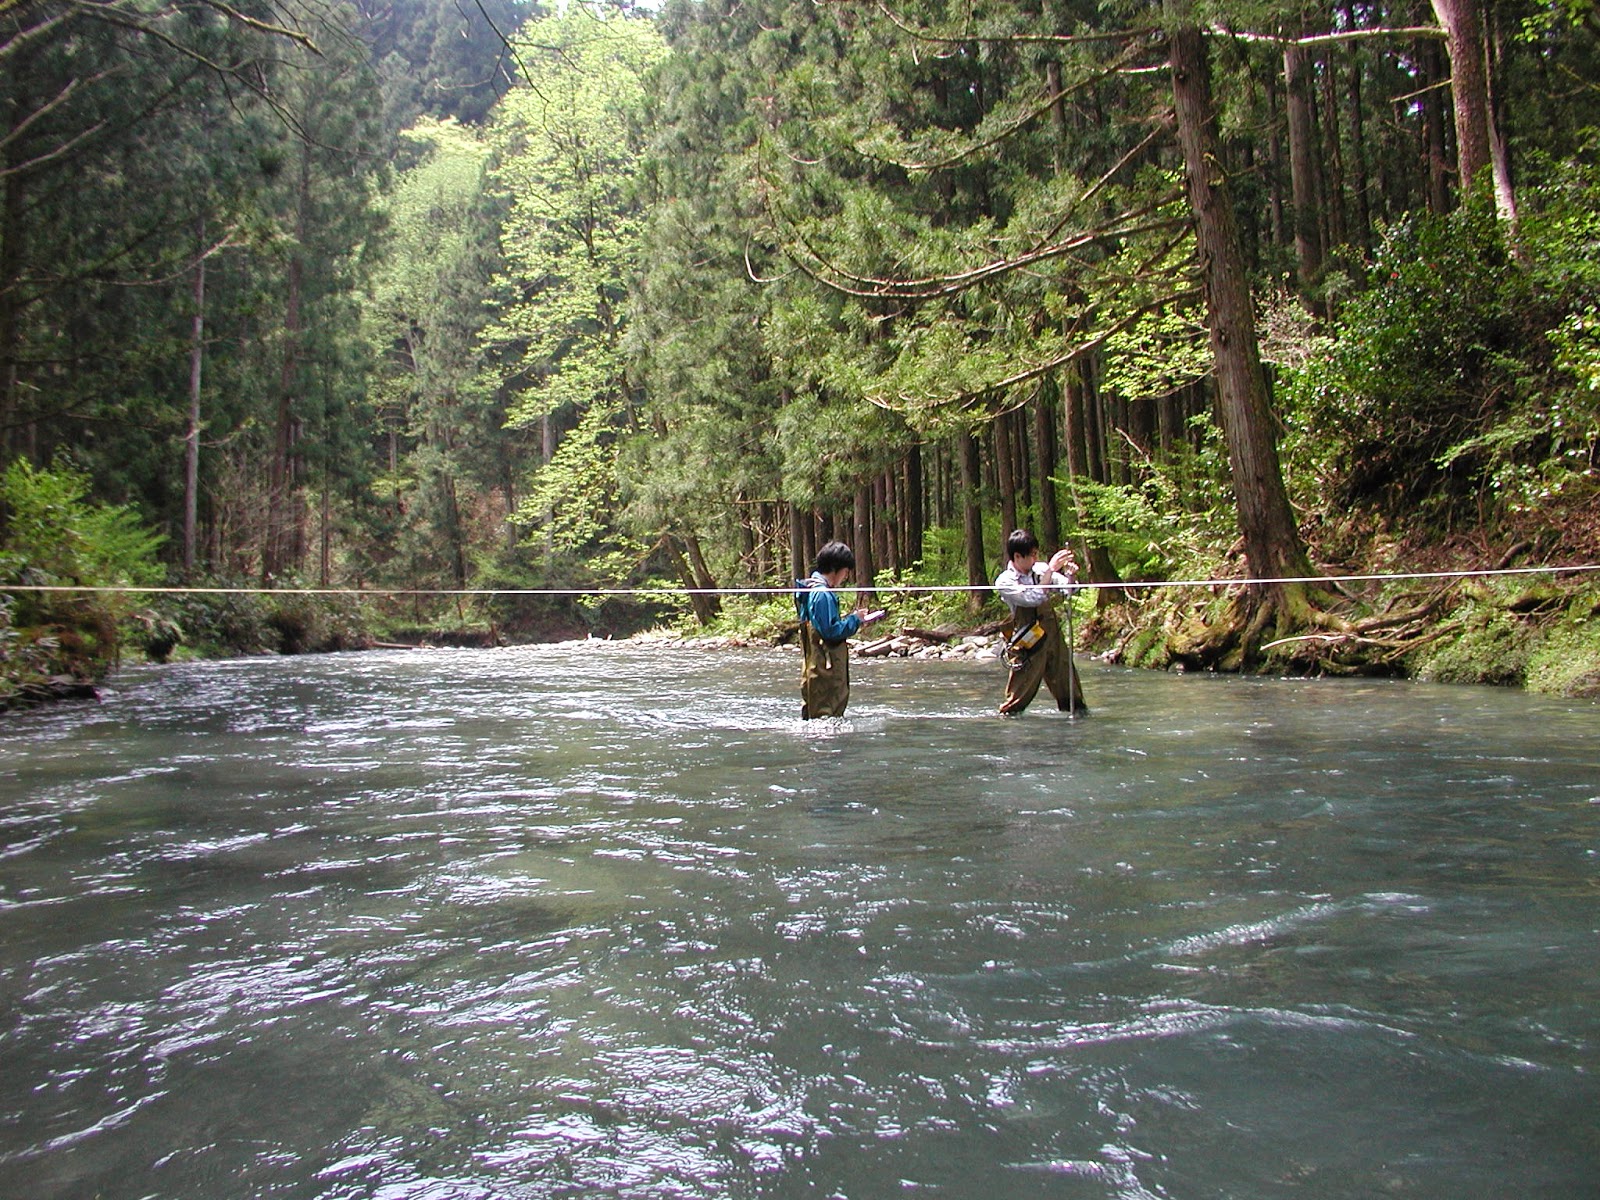
Ta = 22C, Tw = 17C, Stage = 0.32m, Q = 0.357m3/s

Today we also carried out a survey of the channel long-profile, measuring by level the elevation of the channel thalweg and the water surface slope. Over the 90m reach shown in the photo above, the channel slope was 1.14%, while the channel slope over the 100m upstream of the gauge was 0.78%. The overall water surface slope for the 190m reach was 0.948%, with a drop in elevation of 1.801m.


Considering the reach between 50m upstream and 50m downstream of the gauging point, the slope was 0.84% compared to 0.90% surveyed in 2004. This suggests the slope at the gauging point has decreased slightly since 2004. We are currently undertaking an analysis of the hydraulic geometry and stage-rating curves for the gauging point, for which estimates of channel slope are essential. Measurements of channel slope during flood discharge will also be required.

Wednesday, 17 June 2015

Low-flow season


The snowmelt season has now finished for the Takiya basin, and we enter a period of low-flows as dry weather continues through the first 2-3 weeks of June. The hydrograph above shows an overall downward trend in water levels - the diurnal snowmelt pattern disappears at the end of May and after that several small rainfall events interrupt the decrease in flows.

Rainy season has already been in full swing in Kyushu and southern Japan, but it seems the rains will not arrive in Niigata yet. Until the rains come, we will see some of the lowest flows during a year. Annual minimum flows usually occur before the rainy season arrives in late June, or at the end of summer in late September.

Torrential localized rainfall has been a feature of the weather in Japan over the past week as unstable atmospheric conditions prevail. Today the precipitation station north of Takiya basin (Takane) recorded 54mm/h during a storm, while the Miomote station to the south recorded zero rainfall.

Stage = 31.5cm, Q = 0.32m3/s, Ta = 24C, Tw = 17C

Miomote gauge (JMA Amedas network)

Tuesday, 26 May 2015

Snowmelt season draws to a close


The above hydrograph shows how water levels have receded over the past three weeks as snow cover has receded during mostly fine and dry weather. The most recent four days still show a slight diurnal snowmelt response, but it is much smaller in size than at the start of May, indicating snow cover has almost disappeared in the basin. On 1 May discharge was around 2.8 m3/s, but it has fallen to just 0.56 m3/s by 26 May.

There are two noticeable peaks due to rain-on-snow. The first event on May 4-5 occurred after 39 mm of rainfall, while the second event on May 15-16 occurred after 47 mm of rainfall.

Stage = 38 cm, Q = 0.56 m3/s, Ta = 22C, Tw = 14C

Monday, 18 May 2015

JICA study tour


Today I introduced participants from a JICA irrigation and drainage course to the Takiya River field site. Our main exercise was to split into 4 teams and measure the discharge by different methods; (1) electromagnetic current meter with wading rod, (2) hand-held propellor meter, (3) bridge-suspended propellor meter, and (4) float method. The stage was 0.47 m, which is typical for the tail-end of the snowmelt season. Methods 1 and 4 gave a similar result of close to 1.32 m3/s, whereas the propellor meter methods gave somewhat higher estimates. Reasons for the differences are being investigated.

Hand-held propellor method

Bridge-suspended propellor meter method

Electromagnetic current meter method

Float method


Friday, 1 May 2015

Diurnal snowmelt pattern


The last 9 days of April show the typical diurnal snowmelt pattern where water levels rise and fall at a daily frequency due to fluctuations in the snowmelt energy balance between daytime and nighttime. The pattern is especially clear due to the fact that no precipitation at all fell during this time.

The moderate flood peak on April 20-21 was due to rainfall of up to 10 mm/h and an event total of nearly 60 mm (rain-on-snow event).

Stage = 58cm, Discharge = 2.84m3/s

Although levels of suspended sediment were very low, we could observe fine gravel-sized bedload moving on the streambed in the central part of the channel where depths were about 0.45m and velocities about 0.85m/s.

Monday, 13 April 2015

Snow lysimeter runoff complete

Mature cedar lysimeter site

The snowpack has now completely melted at all the lysimeter sites, so today we could download the data and make an initial analysis. Total runoff during Dec-13 to Apr-4 was 808mm at the cedar site, and 874mm at the larch site. Actual runoff at the larch site would have been about 40mm greater, as a rain-on-snow event on Dec-24 caused the drainage to back-up resulting in some missing data at the larch site. The reason for the significantly greater runoff at the larch site is the relative lack of canopy interception and evaporation loss under the deciduous canopy. Time-lapse photography showed us that the larch site melt-off was completed on Apr-2, two days earlier than for the cedar site on Apr-4.

Daily runoff summary for the cedar and larch lysimeter sites

The summary chart of daily runoff for the lysimeter sites shown above tells the story of snowpack dynamics in a maritime climate, with frequent runoff events throughout the winter season. However, you can see that the snowmelt runoff begins to increase and become more consistent from the middle of February. The largest runoff events are caused by rain-on-snow on Dec-24 and Feb-12. On Dec-24 the precipitation recorded locally was 59.5mm which is almost the same as the runoff measured at the cedar site. During the main snowmelt season the daily runoff only reaches 20-25mm/day. You can see the hourly runoff values in the chart below, showing peak values of about 2-3mm/hour during fine weather melt, and 4-5mm/hour during rain-on-snow.


Diurnal melt pattern in the discharge hydrograph with rain-on-snow events Apr-3 and Apr-6


Wednesday, 18 March 2015

Snowmelt season is early

Stage = 59.5cm

Today was a warm day with spring-like conditions. Snowmelt season is well under way, and the water level is up in the river. Snow survey at each of the lysimeter sites confirmed that there has been significant melt over the past 3 weeks, despite some fresh snow accumulation during last week. The chart below shows that peak snow accumulation occurred in early February. The snowpack will likely completely melt in the lower elevations over the next 2-3 weeks. At the larch and young cedar sites the snow depth averaged about 60cm, with relative densities of 0.4 and snow water equivalents of 25cm.


Snow survey at the larch site

The chart below shows the stage hydrograph for Takiya River over the 2 months from mid-January to mid-March. We can see that flows have been elevated since late February, due to snowmelt and rain-on-snow events, and we can even see the diurnal snowmelt pattern which occurs during fine weather conditions.