Wednesday, 16 September 2015
Wet September start
Unsettled weather during the first half of September has raised the soil and groundwater levels. The hydrograph below shows repeated peaks, building in size up to a small peak flow event on 11 September (55mm precipitation over 10-11 Sep.).
Today's fieldwork included taking a velocity profile in the centre of the channel (see figure below), where the flow depth was 24cm. We could confirm that the mean flow velocity in the vertical profile occurs at the depth of 0.6 x depth (measured from the surface). The USGS wading rod that we use makes this assumption in setting the representative depth at which to take a single velocity measurement in each vertical profile.
Tuesday, 1 September 2015
August 15 flash flood
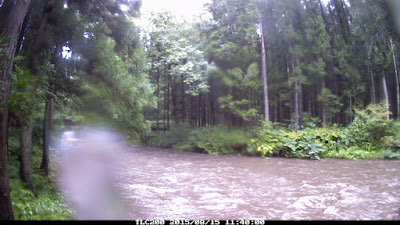
August saw dry conditions return again for the first two weeks, before a sudden flash flood of moderate size on August 15, when river stage rose by about 50cm during just 10 minutes from 11:40 to 11:50, reaching a peak of 1.0m.
Analysis of the local Amedas precipitation at Takane and Miomote shows that the storm path was from north to south, or in other words, the storm path was moving in the downstream direction. This likely contributed to the extremely sudden rise in the stage hydrograph.
North of the basin (Takane) intense precipitation of 6~8mm/10 min. occurred during 9:20~10:00, while south of the basin (Miomote) intense precipitation of 6~12mm/10 min. occurred during 10:30~10:50. Maximum hourly precipitations were 36mm at Takane, and 24.5mm at Miomote.
The series of images below is taken from time-lapse photography at the gauging site. The first five images show the arrival of the intense precipitation, and the last three images show the sudden rise in the river stage.
Subscribe to:
Comments (Atom)


