Friday, 28 December 2012

Early winter


Stage = 47.5cm

First snow survey of the winter season today. About 30-50cm of snowpack around the gauging station in the lower elevations. The students carried out the snow survey while I checked on all the lysimeter drains and data loggers. Before the snow accumulates it is usual for the drains to become blocked by needles from the trees. Therefore, it is important to dig out the snow over each drain, clean it out, and then return the snow over the top. At the mature cedar site, all 3 drains were blocked and the lysimeter trays were filled with freezing water (runoff data lost up to December 28). Nothing like dipping your hand into that freezing water to clean out the drains!

Lysimeter at the young cedar site

Monday, 3 December 2012

Winter preparation

Snow lysimeter at the larch site

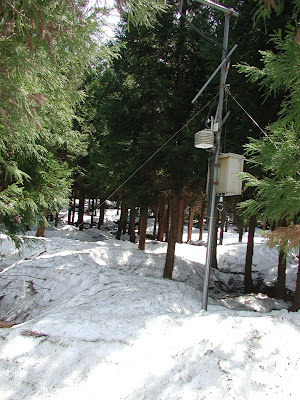
Today we did the last of the winter preparation by completing the cleaning and checking of the snow lysimeters at Takiya River. There are three snow lysimeters (larch site shown above, mature cedar site, and young cedar site) that monitor the runoff below the snowpack throughout the winter and spring seasons. At each site three large plastic trays collect the runoff and feed it through pipes to a large tipping bucket device (capacity 200mL and 500mL). In short, we are measuring the snowmelt and rain-on-snow runoff, and comparing between the three sites. This experiment has been running for 10 years now! So we can also look at the long-term trends and patterns.


Cleaning finished

Thursday, 22 November 2012

Rainy November


The hydrograph above shows the river water level (at 10 minute intervals) from 19 October to 22 November. Compared to the last hydrograph I uploaded on 19 October, we can see that rain storms are becoming more and more frequent as we move into November. On 23 October there is a medium size flood peak of about 1.1m, but the peak is short-lived and by 28 October the water level has fallen rapidly to only 43cm, close to the summer low flow level of 40cm. In November the rain storms are much more frequent so that water levels are almost always above 60cm. The soils in the basin are becoming wetter and wetter and the ground water levels are on the rise as we head towards winter.


Takiya River stage = 57cm

Wednesday, 7 November 2012

Autumn storms

Takiya River, stage = 60cm, Ta = 11C, Tw = 12C

The season has really changed now that we are into November. The autumn rains are really picking up, and today we got hit by several thunderstorms. The rain was torrential at times, but when we arrived at Takiya River the water level was still only moderate. This was good. It allowed us to get into the river to make a couple of discharge measurements. We always need more data for discharge measurements when the water level is up - these are vital for making the stage-discharge curve (H-Q curve). But when the river is really high, it's too dangerous or even impossible to make a measurement.

Today we had five members in our team, including one first time member. To everyone, thanks for getting out and working in the rain!

Friday, 19 October 2012

New water year

Flows are up! Stage = 48.2 cm

October marks the start of the new water year in many temperate climates of the northern hemisphere. September brings the late summer minimum flows and generally the river basin is in a very dry condition. The new water year begins in this season when water storage within the basin is at a minimum. The groundwater levels are at their lowest, and soil water content is also at a minimum.


During the autumn season, rainfall becomes more frequent, evapotranspiration levels decrease with falling temperatures and shortening day length, and so the soil moisture and groundwater levels begin to rise. Look at the hydrograph above and see how the low flows between the rainfall events are starting to increase above the summer minimum of around 40 cm stage.

Come early winter and snowpack will begin to accumulate, adding further to the storage of water resources in the basin. In winter, we will switch from measuring the streamflow to measuring the snowpack to keep track of the water resources of Takiya River.

Friday, 28 September 2012

New team members

Stage = 43.5 cm, summer low flow continues

Today we were joined by two new team members. The typical induction to Team Hydrology is to take a discharge measurement, our all-important work at Takiya River. Fourth year student team members pass on their skills to the new third year members.

The hydrograph below shows that there have been three rainfall events during the second half of September, including one small size flood on September 24th. However, streamflows quickly return to a summer low flow condition. The minimum stage of 40 cm around September 18-19th is likely to be the minimum flow for the year.

Friday, 14 September 2012

Summer low flows


This summer continues to be relatively dry, as shown in the hydrograph above for the first half of September. The months of June and August have been especially dry as we can see for the precipitation data at Miomote (Amedas):

2012 Monthly Precipitation (with 1981-2010 mean)
June  59 mm (180)
July  201 mm (263)
August  81 mm (209)

No rain fell at all during the 18 days from July 26 to August 12, and the 13 days from 17-29 August. In fact the month of August recorded only 5 days with rainfall.

Stage = 41.5 cm, close to the minimum flow for the summer

Wednesday, 29 August 2012

Hot dry summer


Over a month has passed since our last fieldwork at Takiya River. This summer has turned out to be very hot and dry, and river levels are very low throughout Niigata. The hydrograph above shows there has only been two or three rainfall events in the past 5 weeks! There are two very long periods of flow recession without any rainfall. The influence of the forest vegetation evapotranspiration on the low flows can be seen by the daily fluctuations over the past two weeks.

Although this is high season for leeches and horseflies, we were only hassled by a few of the latter. The very dry conditions this year have kept the number of insects to a minimum.

Of particular note is that the authorities have removed all the fallen trees from the river below the gauging point. About 10 fallen cedar trees in total were removed. Apart from the caterpillar tracks on the river bank, the negative impacts on the river environment seem to be minimal.


Taking a discharge measurement (stage = 42cm, water temperature = 21 C)

All the fallen trees have been removed from the river below the gauging point

Friday, 17 August 2012

Uonogawa field trip

Gauging station on the Uonogawa at Horinouchi (A = 1400 km2)

Currently Team Hydrology are working with data from the Uonogawa River in the upper reaches of the Shinano River. This river basin has especially heavy snowpack in winter and very rich water resources which are used downstream throughout the Niigata Plain for rice paddy agriculture.

Today we visited several hydrometric monitoring stations that measure streamflow, precipitation, and snowpack in the basin, as well as the major dam site within the basin at Kuromatagawa Dam. When using data for hydrological simulation, it is important to see first-hand where and how the data has been collected!

Amedas weather station at Irihirose where snowpack exceeds 3m in winter
 
Snow cat machine at Irihirose

Kuromatagawa Dam

Shinano River gauging station at Ojiya (largest river discharge in Japan!)

Monday, 23 July 2012

Not much of a rainy season


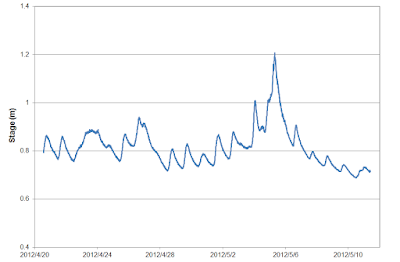
This year, we did not have much of a rainy season here in Niigata. Southern Japan had torrential rains and flooding, but in Niigata we only had relatively light rains. The hydrograph above for Takiya River shows only minor floods, and by the end of July water levels are already quite low.

If we don't get more rain throughout the summer then we may be having water shortages. However, the spring and early summer snowmelt has topped up the groundwater levels which are so vital in maintaining river flows throughout the summer season.

As usual we measured the discharge to add further data to the stage-discharge relationship (H-Q curve). While doing this work, we could enjoy watching the "akatonbo" colourful dragonflies dancing above the river.
Stage = 48.5 cm, Tw = 17.7 C

Wednesday, 27 June 2012

Waiting for the rain


The above hydrograph shows a small runoff event on June 20, when about 20-30mm of rain fell over the catchment (maximum intensity 8mm/h at both Miomote and Takane Amedas stations). The big rains of the season are yet to arrive. Sometimes they come right at the end of June, or during the first two weeks of July.

27 June, stage = 47.5cm (exactly the same as on 13 June)

Amedas precipitation gauge at Miomote. This gauge has a heated jacket system to measure both winter snow and rain. It is also set high at 3.5m above ground level to be clear of the winter snowpack.

Miomote River just below Miomote Dam

Wednesday, 13 June 2012

Early summer low flows


The hydrograph above shows falling low flows. The last diurnal snowmelt pattern is just visible initially, but this disappears as the snowpack finally melts away. We enter a period of dry sunny weather when river levels become low before the arrival of the rainy season storms.

13 June, stage = 47.5cm, snowmelt season is over

Wednesday, 30 May 2012

Snowmelt tails away


The hydrograph above shows one rain-on-snow peak on 16 May, followed by mostly dry fine weather when you can clearly see the daily snowmelt pattern. You will also see that the water level is on a downward trend through the second half of May, with the daily melt wave-pattern becoming smaller and smaller. This tells us that the snowpack is disappearing quickly.

30 May, stage = 54cm, snowmelt season nearly over

Friday, 11 May 2012

Peak snowmelt

11 May, stage = 71cm. Is peak snowmelt over?


End of April to early May usually brings the peak snowmelt. This year is no exception. See the clear sine-wave pattern in the hydrograph that reflects the same pattern in daily air temperatures which are driving the snowmelt. April 28 to May 2 is a period of fine dry weather with only snowmelt driving the streamflow, but the next three days are influenced by rainfall which causes the largest peak on May 5, a typical rain-on-snow flood event.

Snow has now melted off from the lower elevations, and so the fine weather snowmelt pattern is likely to slowly fade out over the next couple of weeks as the snowline retreats up into the mountains.

Friday, 20 April 2012

Melting snows


Streamflows increase steadily from March through April

Larch site snow lysimeter

Mature cedar site snow lysimeter

Young cedar site snow lysimeter

Tracks in the snow (Kamoshika deer)


After a one-month break from visiting Takiya River, there had been a major change in the seasons from late winter to full swing snowmelt season. Study the hydrograph above and see how the streamflows have increased steadily from the start of March. There are several peaks which generally occur with rain-on-snow, but notice how the low-flow level between the peaks is rising through March and April. This is the season when discharge is consistently high due to the melting snows. April normally has the largest monthly discharge value for the year.

Thursday, 22 March 2012

Mountain snow survey

View upvalley from summit (610m) after 2 hours of climbing

The high elevation beech forest (snow depth 250cm, SWE 100cm)

Takiya River stage = 55cm

Wednesday, 7 March 2012

Rain-on-snow

Warm temperatures and rain over the past few days swelled the river

Today's team at the tributary precipitation guage

Monday, 13 February 2012

Deep Niigata snows

Typical mid-winter scene at the gauging station (low flow)

Fetching water for our lunch time coffee brew

Climbing up to the tributary site

Tributary site snow survey

Larch lysimeter site

Tributary cedar lysimeter site

Valley bottom cedar lysimeter site

Local village of Nunobe